

Christmas Below $100k: The Missing Parabolic Rally
On-Chain Supply Gap

Dear Bitcoiners,
I want to express my sincere gratitude to you for following my work. I don’t pretend to know what the future holds, as every cycle has its differences, yet on-chain analysis has helped enormously in understanding what’s going on and determining under- and overvaluation levels. I sincerely hope it has made you feel more prepared. Merry Christmas! 🧡🎄🥕
Celebrating Christmas with Bitcoin under $100k might not feel like a blessing, but really the only thing missing this cycle has been the much-hoped-for end-of-cycle parabolic rally. We’ve seen a three-year uptrend, largely absent of retail, with more gradual institutional demand paired with significant OG selling.
The good thing about not having that parabolic move is that it isn’t sustainable anyway. The stronger the overextension, the heavier the correction. Additionally, one quickly gets used to the size of their portfolio after such a move up, but the following 80% correction is a mental rollercoaster. Bitcoin might feel boring now, but the downside risk of this correction, whether it represents the end of the 4-year cycle or not, is much more limited.
We recently mapped out the downside risk and all key support levels in a single live chart, available to all paid subscribers.
During this drawdown, we’ve experienced more severe capitulation than during the drawdowns that followed the ETF and election rallies. This can be observed in the rate of change and the drop in the STH cost basis.
Exactly one month ago, we saw a strong capitulation wick down to $80k, which has, so far, held steady (see chart below).
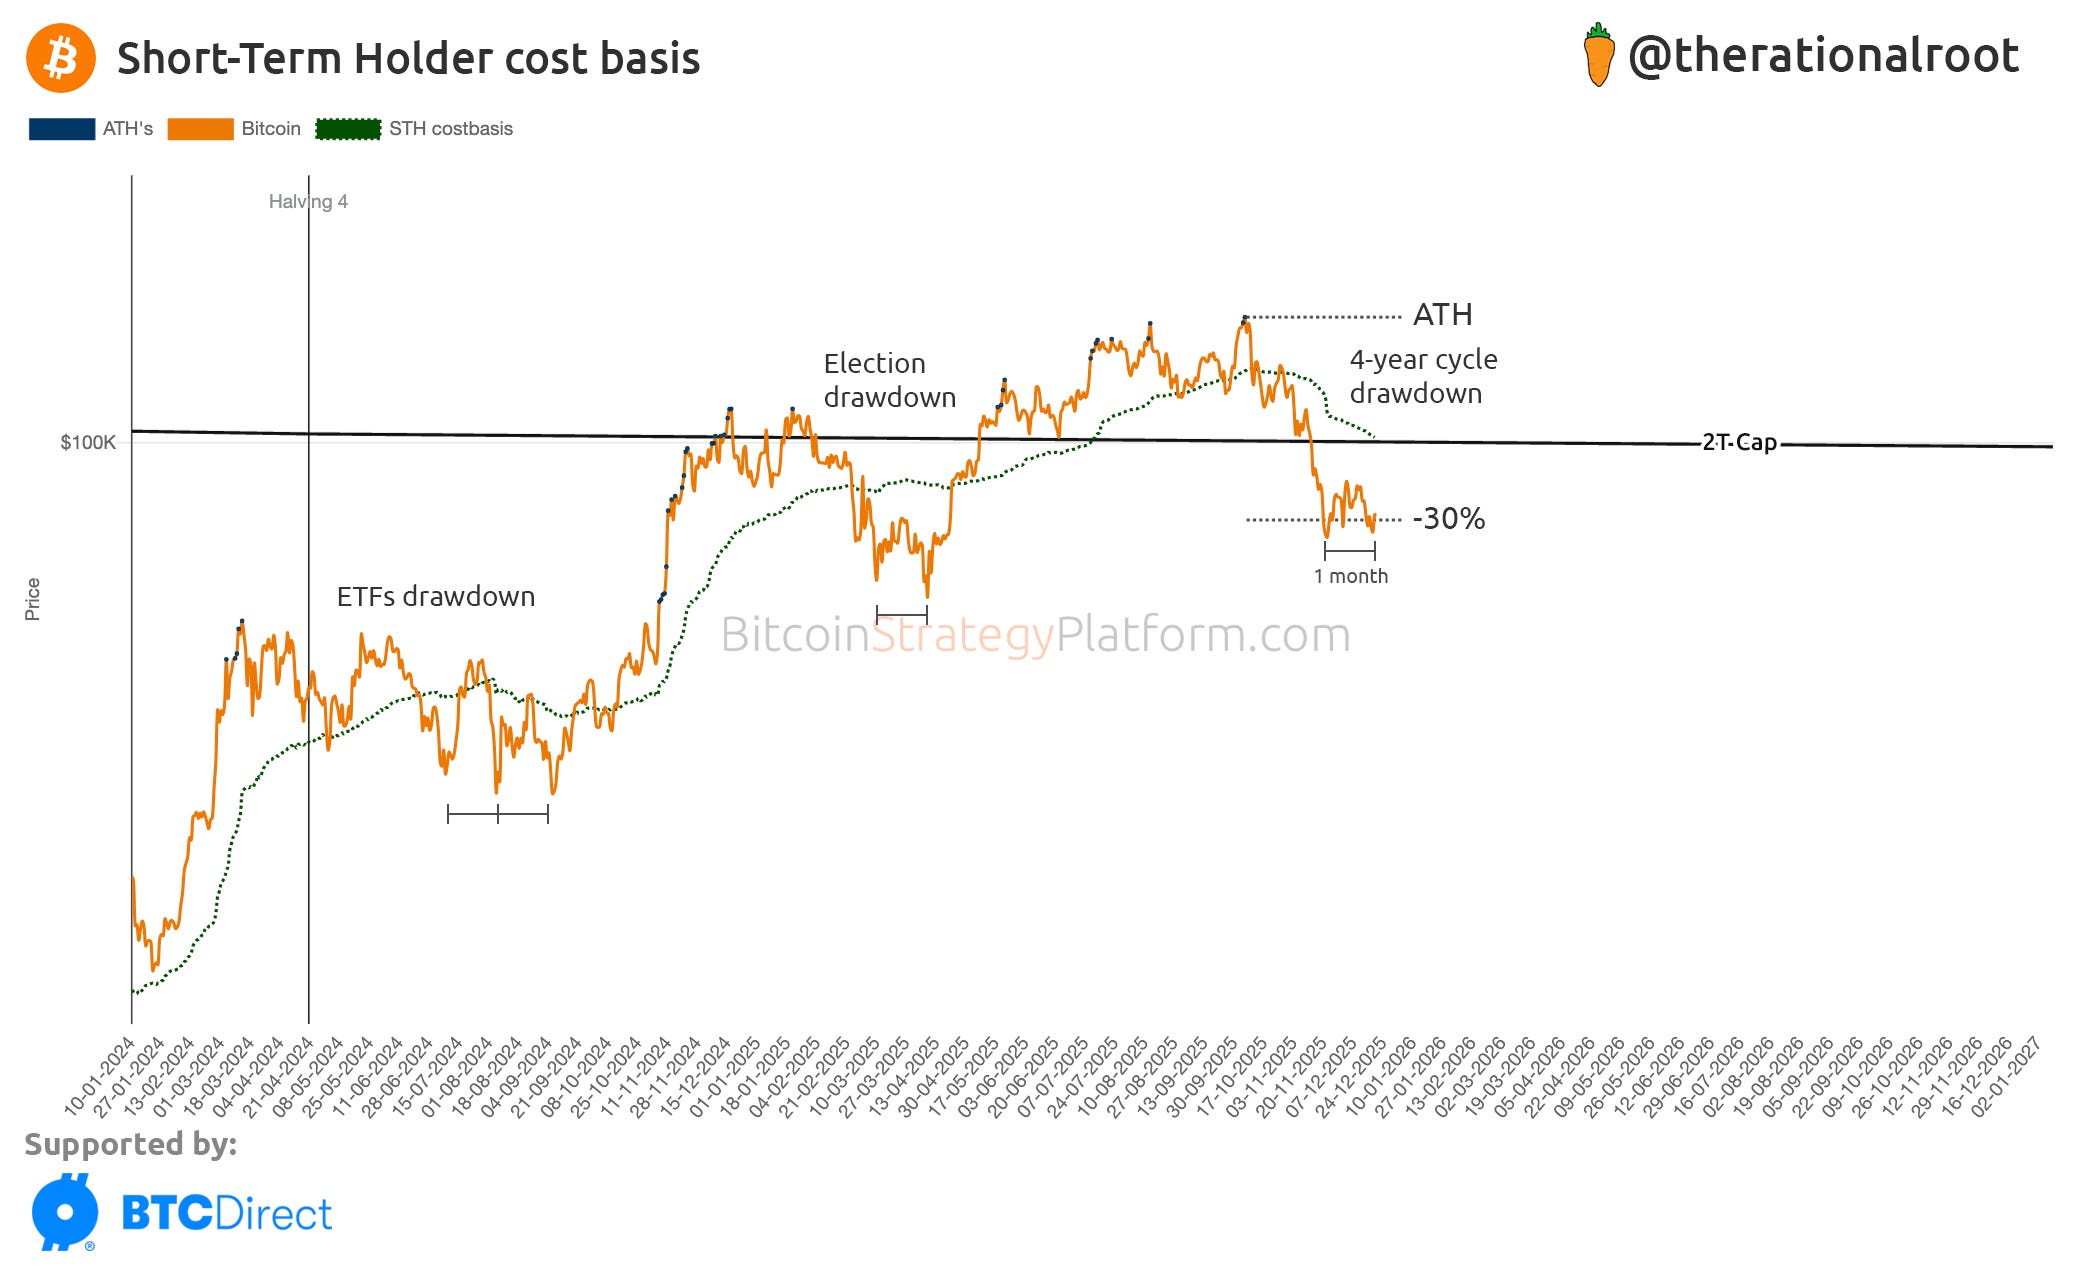
👉 Key insight: As seen during previous drawdowns, Bitcoin tends to make lows and then retest the STH cost basis. Often, the time between lows, and between retests, is about a month.
Currently, the STH cost basis has dropped to the psychological level of $100k, which also represents the $2T (multi-trillion-dollar) market cap. If we were to retest the STH cost basis, it is likely to act as resistance. In last week’s newsletter, we provided a detailed report and access to a live chart tracking all resistance levels. You can find that newsletter here:

In this newsletter, we’ll take a look at the latest on-chain supply distribution and what it means for price action.
