Trillion Dollar Market Cap: $51,000 Target
NEW CHART & Resistance and Support Levels (Detailed Breakdown)
Dear Bitcoiners,
This week, I'll present a new chart that combines several concepts we've discussed recently: on-chain valuation model, recovery progress, Short-Term Holder behavior, historical levels, supply distribution, and last week’s rally comparison. We'll break these down, defining resistance and support levels, all in one easy-to-understand chart to guide your next moves!
Missed last week’s rally comparison? You can find it here:
But first, let’s take a glance at Bitcoin’s market cap, now at $837 Billion.
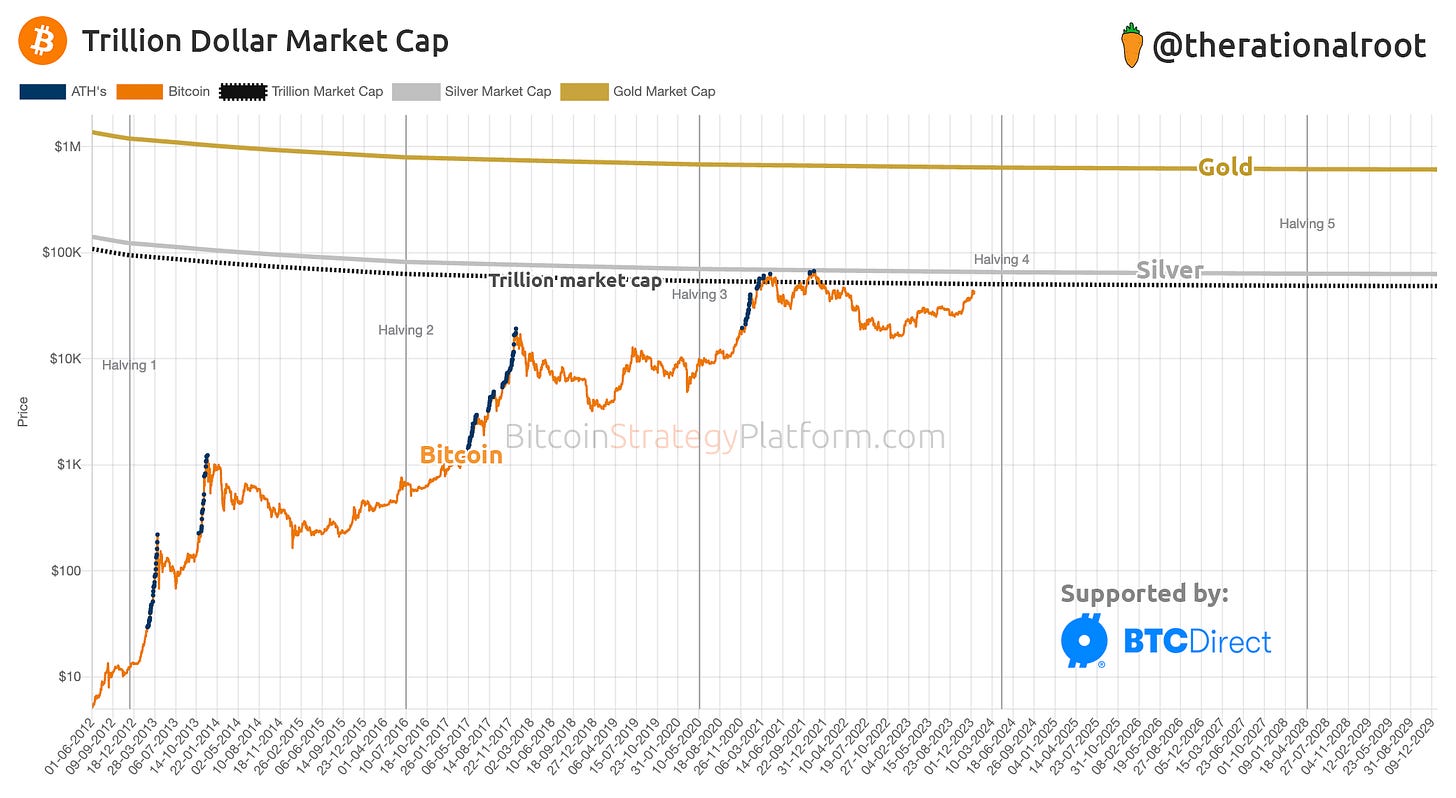
Trillion Dollar Market Cap in Sight
With a high likelihood of ETF approval in early 2024, Bitcoin is also on track to surpass the trillion-dollar market cap milestone. Before setting new all-time highs, we’ll first reach this trillion-dollar milestone. Alongside an ETF, this milestone further solidifies Bitcoin's position as an institutional-grade asset.
The target price for Bitcoin to hit a trillion-dollar market cap is around $51,000. In the next section, we'll explore the potential timeframe to reach this target. Given Bitcoin's current exhaustion, remember the 10k steps in Bitcoin’s supply distribution? It recently found resistance near $47,000, a level of historic supply significance.
Grab the 30% discount before Christmas.
Full Newsletters and gain access to the Bitcoin Strategy Platform with high precision charts.
Up Next:
The chart you don’t want to miss! We’ll reveal all crucial support and resistance levels combined into a single chart.


