


The Price impact of ETFs Flows
The Price impact of ETFs Flows
15% Dip, Outlook

Dear Bitcoiners,
We finally got the dip that was long due, but so far, we’ve only seen a 15% drop. In previous cycles, we've often seen dips of 30% during bull markets. Will we continue dipping to -30%? Will we still have a continuation of the bull market? In this edition, we’ll try to answer these questions! We’ll discuss the ongoing dynamics and look at support & resistance levels, and we’ll have a detailed look at the price impact of the ever-so-important ETF flows. As always, with Bitcoin Strategy, the aim is to bring you data-driven insights.
ETF Flows and their Price Impact
The ETF flows, which we have closely monitored with our ETF Tracker, are a major part of the demand that drives this bull market. Of course there are other factors, like you and I stacking, Microstrategy’s stock, derivatives, etc. While we have seen a substantial increase in futures open interest compared to the last cycle, especially since the beginning of March, this cycle has been substantially driven by spot purchases, more akin to the 2016/17 bull market.
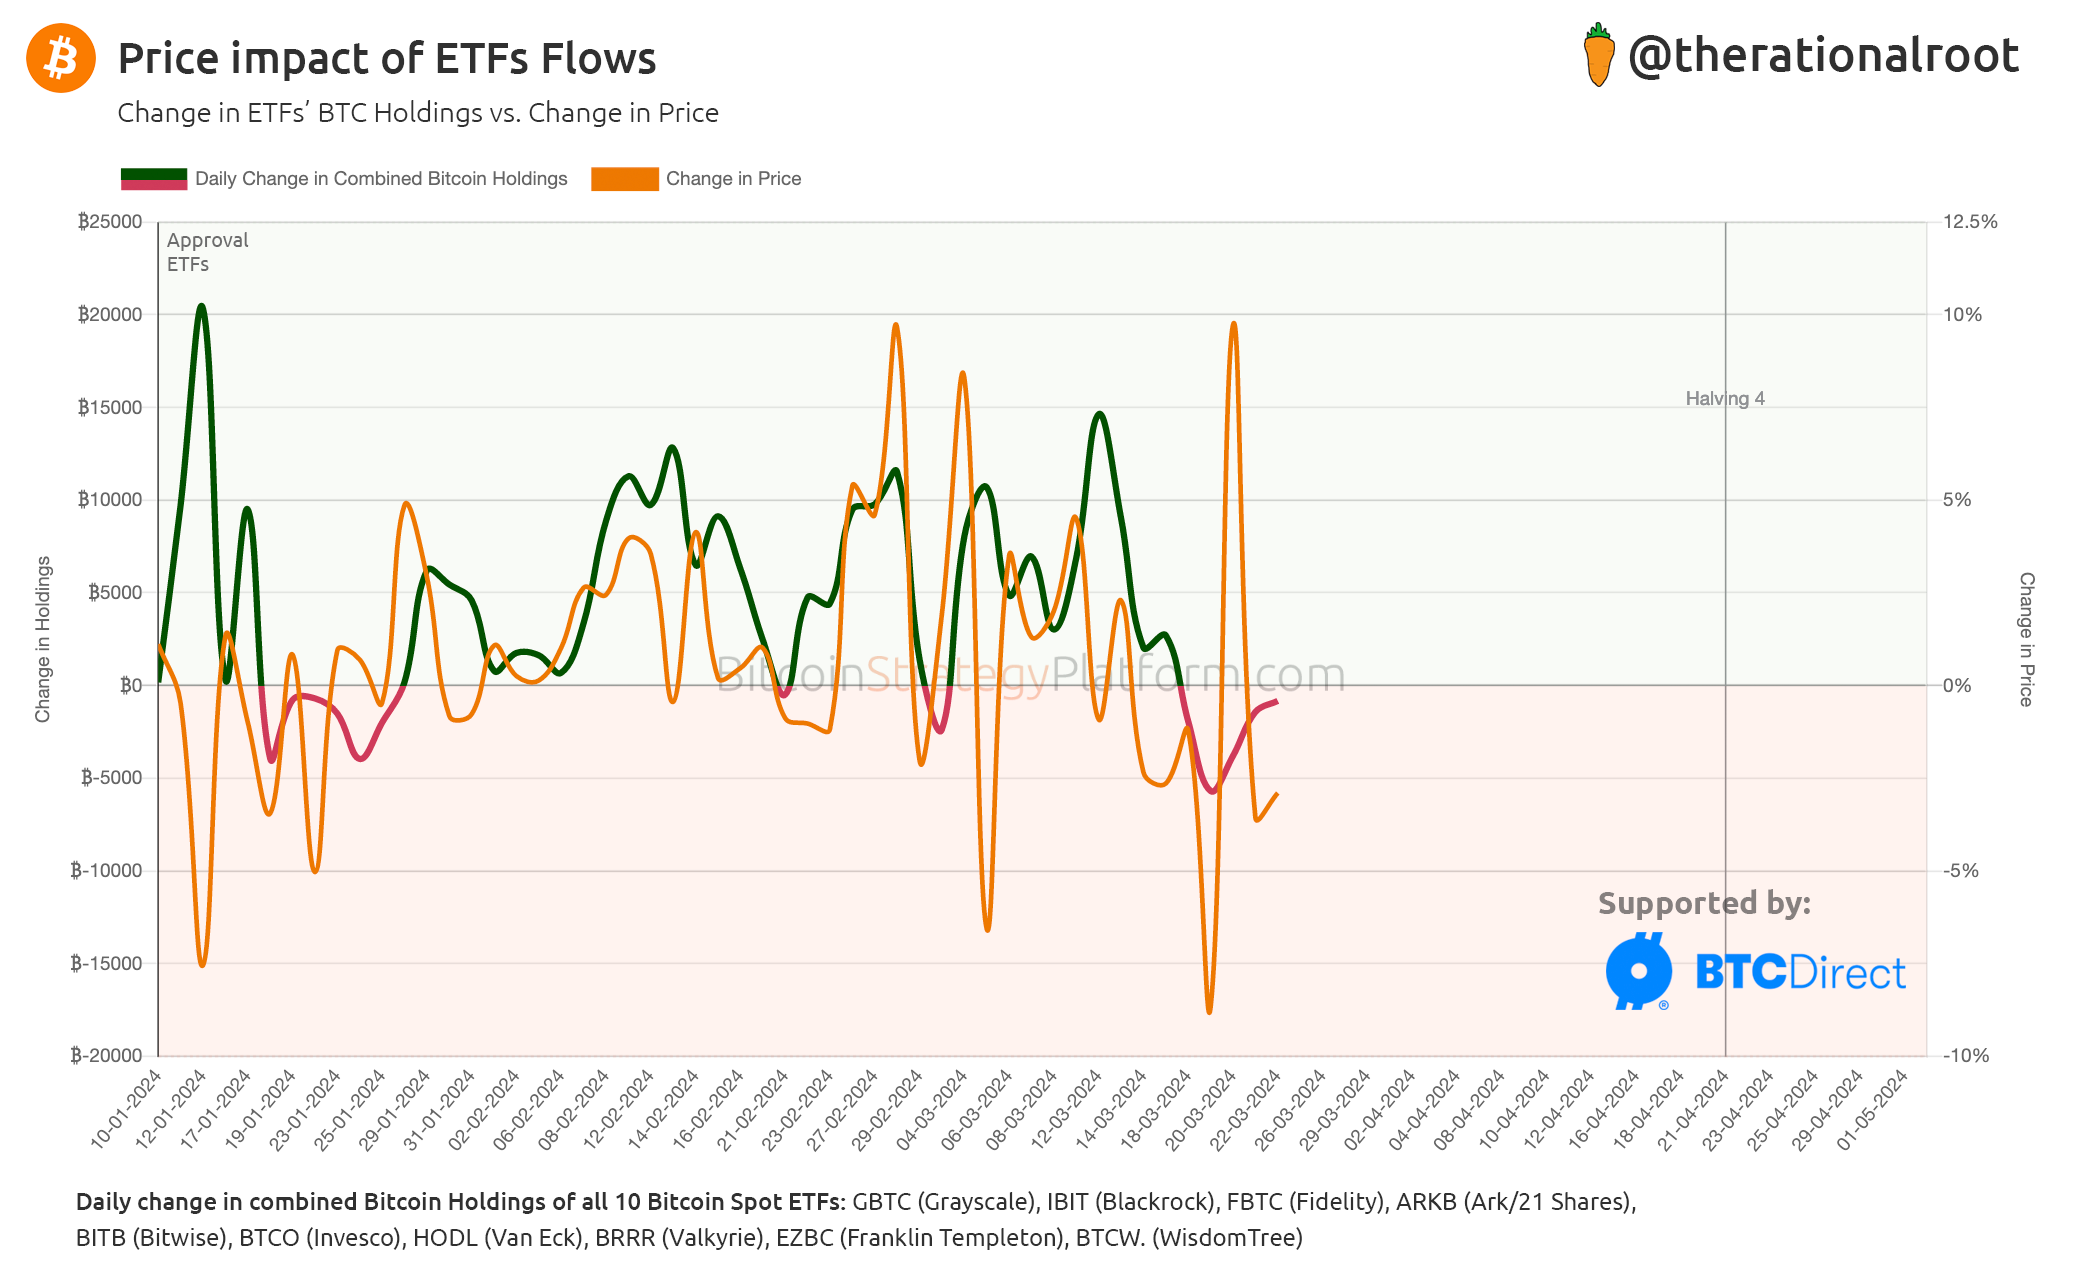
In the chart below, we observe the change in cumulative BTC holdings of the 10 spot ETFs and compare that to the change in the Bitcoin price.
Key Insights
The change in Holdings vs. the price change follow a similar path, except for a few outliers. One of these outliers occurred last Wednesday when we saw a 10% rise in price despite observing net outflows from the ETFs. A couple of outliers in over two months is not particularly much. To me, this chart suggests that the ETFs are a major driver, confirming that we are in a market driven by spot purchases.
Gain immediate access to premium live indicators, charts, and full newsletter content, alongside a lifetime 25% discount.
Next, let’s discuss the dynamics of the current dip by examining important support and resistance levels and determining the likelihood of a continuation of the bull market.