The 4-Year Cycle: Is This Time Different?
Bitcoin Dipping: Price Action and Short-Term Outlook

Dear Bitcoiners,
Across all cycle comparison charts, we are in the territory of a cycle peak. Whether we look at:
The Spiral Chart (the 4-year cycle): Q4 is historically where we see cycle peaks.
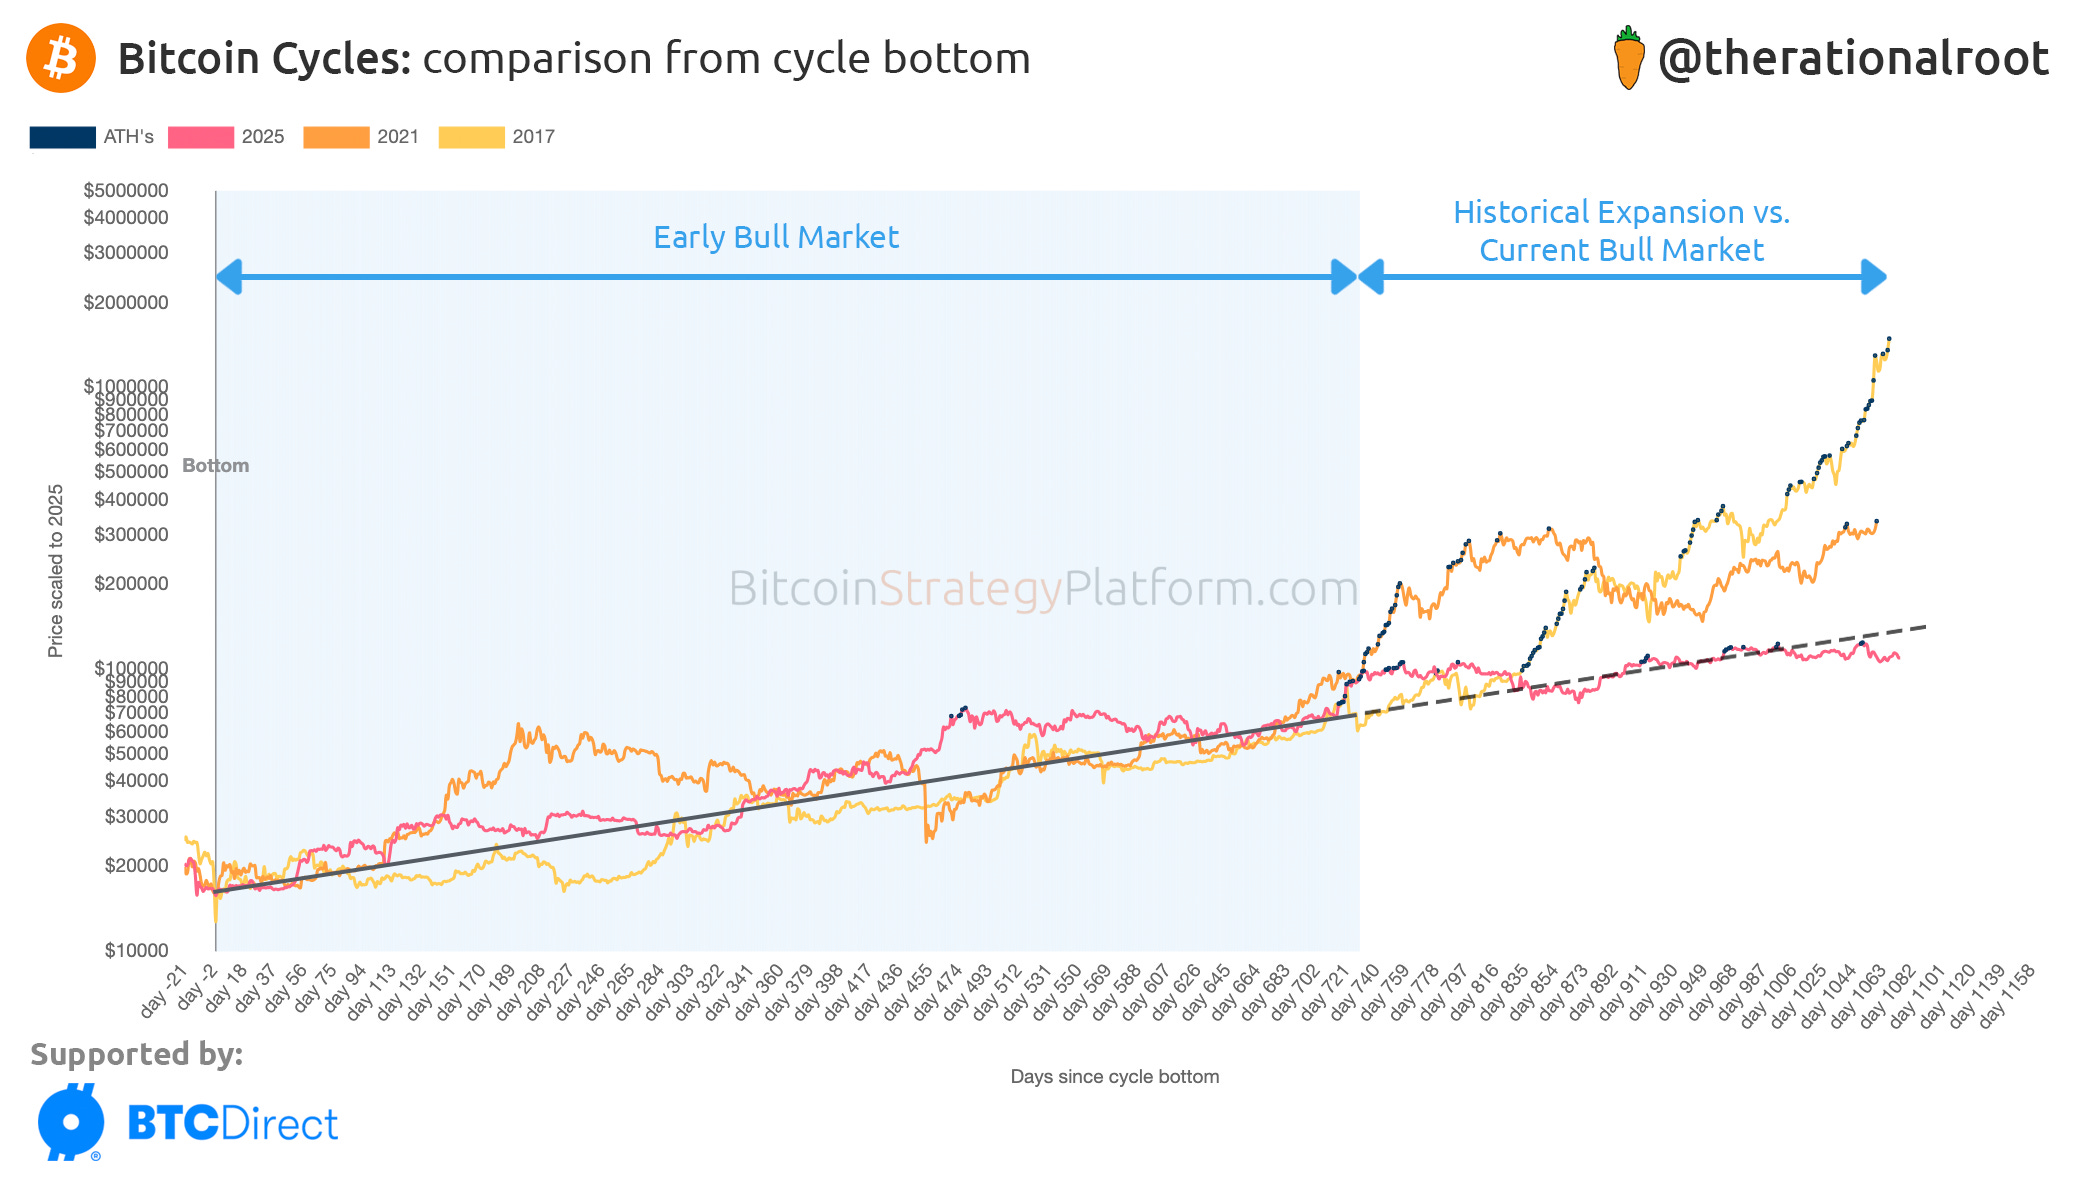
Cycles measured from the bear market bottom (chart below): we’ve now surpassed previous cycle peaks.
Cycles measured from the halving: we’re currently around 39% (measured in blocks), where all previous cycles had already peaked. However, when measured in days, the previous cycle had not yet peaked.
In this newsletter, we’ll discuss the 4-year cycle and the current price action.