

STH Bands: The Bottom Formation
Time to DCA? Phase 2 of the Bottom Formation

Dear Bitcoiners,
This week, we’ll use a different on-chain approach, based on STH Bands, to determine Bitcoin’s position in the bottom formation and why it supports my personal DCA approach.
Over the past weeks, we’ve used different on-chain methods to analyze the cycle bottom. Each method brought new insights, and there has been strong confluence among them.
On-Chain Value Map: we compared cycle bottoms and identified the Deep Undervaluation level.
CVDD & Realized Price: we identified the Bottom Formation & Low Consolidation phase, where CVDD takes over as the global floor.
Drawdown in Realized Price: we used the Realized Price to determine a potential worst-case scenario.
From both a cycle perspective and multiple on-chain indicators, it is clear that Bitcoin is undergoing its bottom formation.
Personal update (not financial advice): I’ve shared my personal approach before, including how I took profits at $97k in mid-January in preparation for a bear market. I have now started my monthly DCA, which I will keep doing for the next couple of months. The idea isn’t to catch the possible wick that marks the exact cycle bottom, but to average in during the remainder of the bottom formation.
Create a Roxom account and get access to Bitcoin-denominated capital markets, including digital credit instruments that can pay income in BTC. Click here or use code ROOT.
This week, we’ll analyze the bottom formation from the perspective of STH Bands. The STH Bands are based on the Short-Term Holder Cost Basis and represent max-pain levels where Short-Term Holders typically hold at a loss before capitulating. When Bitcoin transfers from weak hands to strong hands, these levels often act as major support zones.
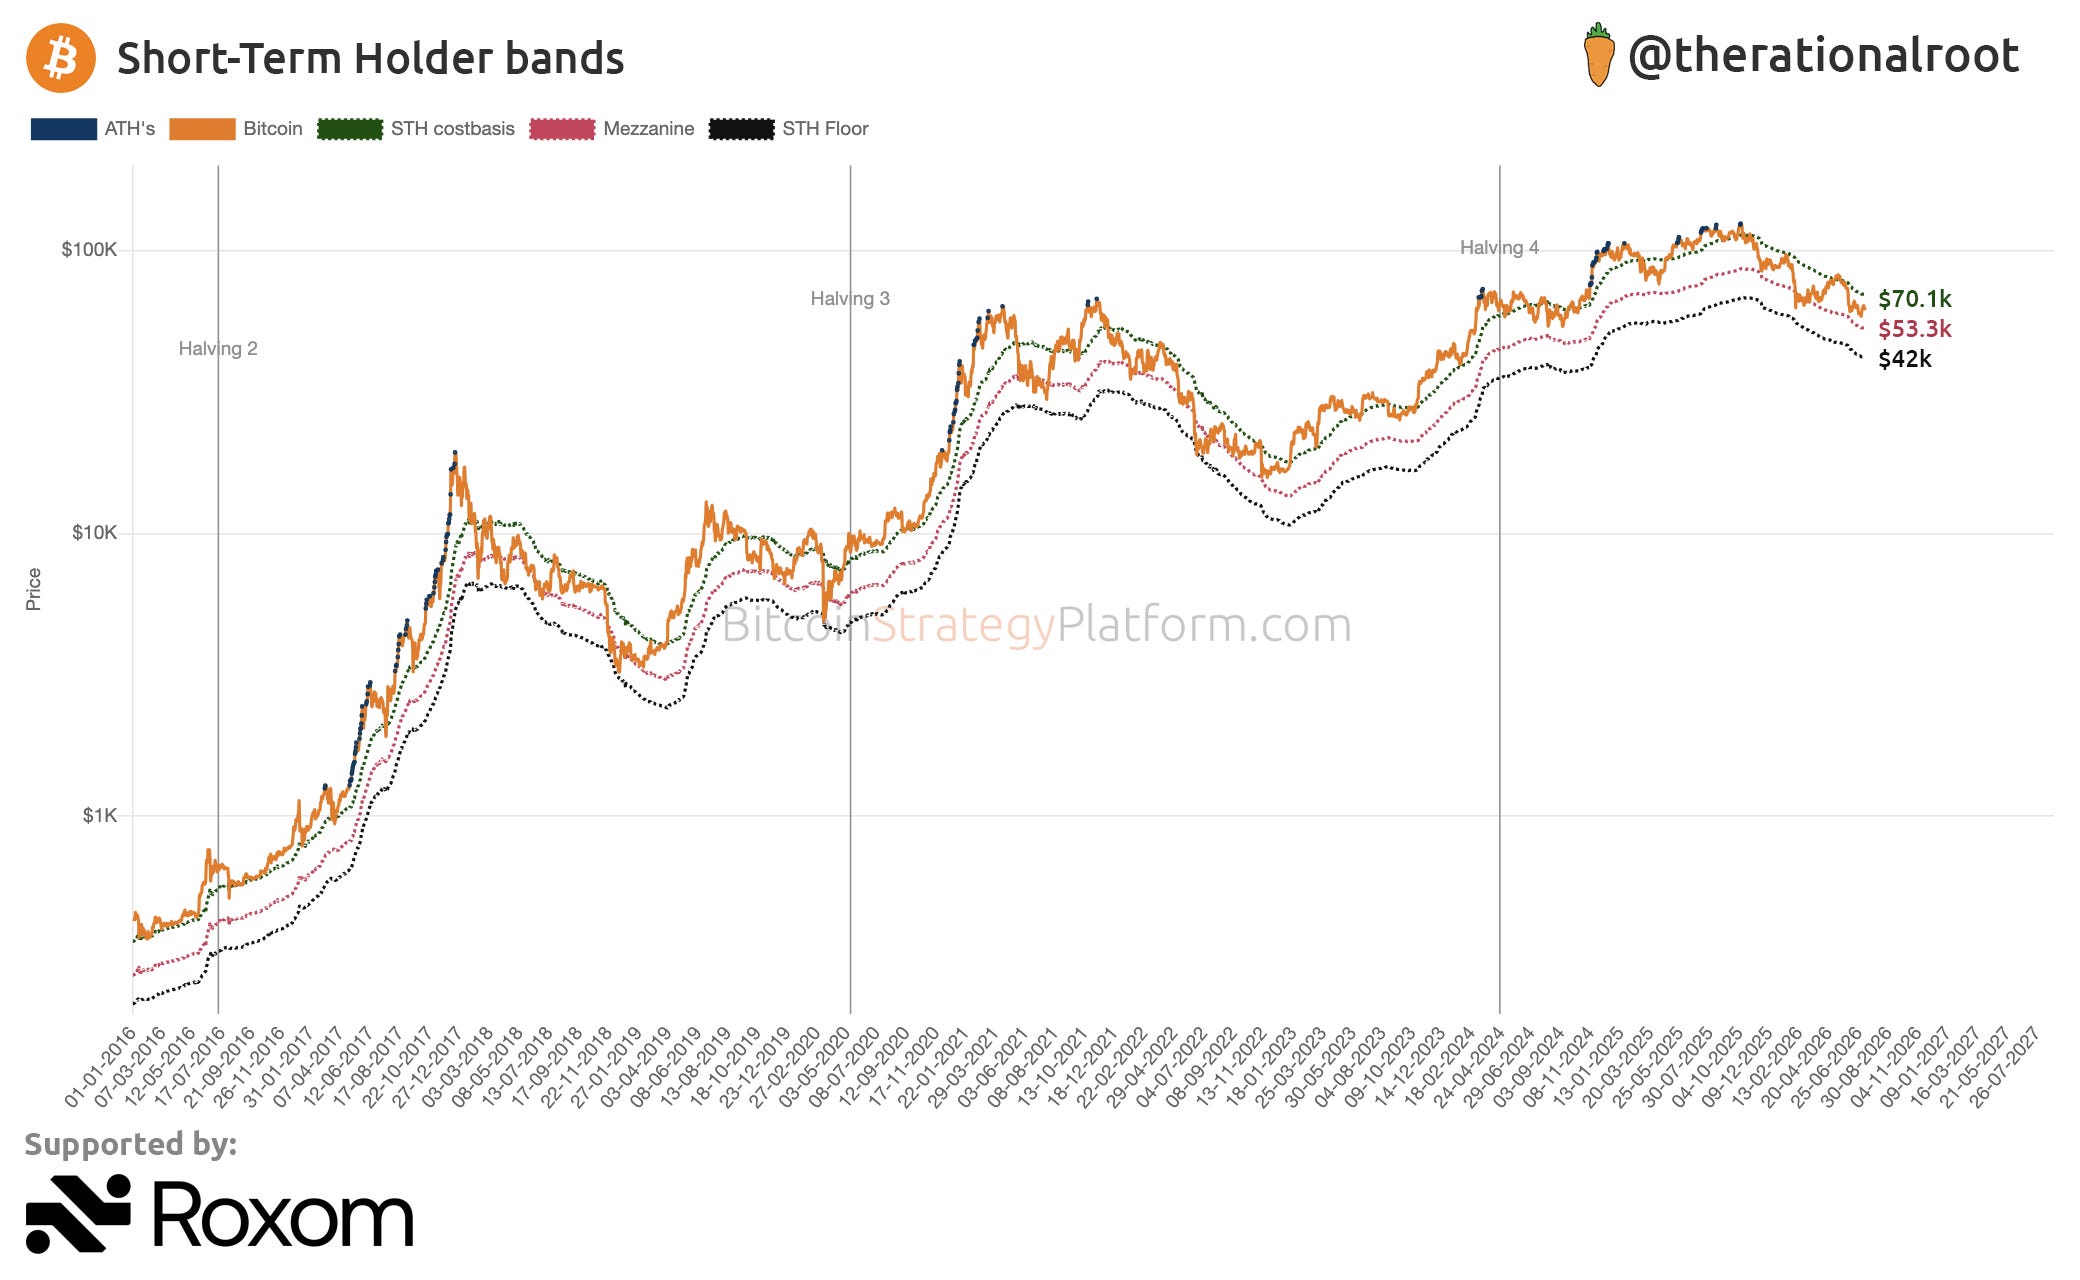
👉 Key insight: In each cycle, Bitcoin reached the STH Floor during the bottom formation, followed by a move around the STH Mezzanine level. This cycle, Bitcoin only fell below the STH Mezzanine during the February drop and never reached the STH Floor.
Unlock access to the Bitcoin Strategy Platform with all premium curated live charts and indicators. Claim your 25% lifetime discount today!
Up next: STH Bands combined with the Realized Price allow us to determine Bitcoin’s position in the bottom formation and reveal important insights about the February drop.
