Hello Bitcoiners!
We’ve observed heavy ETF outflows over the past two weeks, which have been putting significant pressure on Bitcoin’s price. Sentiment is nearing a low, affected by the choppy price action and recessionary fears. Meanwhile, Bitcoin remains in its downward channel, which we’ve been stuck in for the past six months. Is the end in sight? Where can we go from here? This week, I’ve lined up a ton of insights for you! Dive in below and explore everything on Bitcoin Strategy!
Before we dive into our market analysis, I want to share that significant updates have been made to our ETF Tracker, now version 4.0! Here’s what’s new:
New Chart: ETFs’ Absorption of New Supply Issuance
New Chart: ETFs’ Overall & Individual Average Purchase Price
The Bitcoin Strategy Platform remains one of the top tools for premium indicators and charts, available to all paid subscribers—and many more exciting updates are coming soon! Sign up today and get access to the Bitcoin Strategy Platform with a special discount:
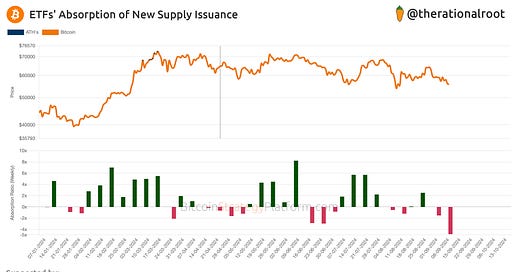
ETFs' Absorption of New Supply Issuance
ETF demand is a major driver of Bitcoin’s price action. In the chart above, we compare the weekly ETF flows to Bitcoin’s new supply issuance, currently around ~450 coins a day added to the network. ETFs’ net inflows offset (or absorb) new supply issuance, while net outflows contribute to additional sell pressure.
This week’s sell pressure is nearly 5x the new supply issuance. Each bar in the chart represents a week, and you can see how closely price correlates with these bars. Historically, we’ve typically seen 2 or 3 bars of sell pressure before absorption.
The majority of these outflows are coming from Fidelity and Ark/21Shares, while BlackRock has seen nearly zero inflow/outflow during this period. Now, let’s look at the second new chart added to the ETF Tracker: ETFs’ Average Purchase Price (Cost Basis). We’ll follow that with a discussion on price action and key levels to keep an eye on over the coming weeks.


