


Macro & On-Chain
CHART PACK

Hello Bitcoiners,
This week, I had the privilege of discussing macro and on-chain with Dylan LeClair, hosted by Bitcoin Magazine. Dylan, who has a deep understanding of these topics, is currently the head of Bitcoin strategy at Metaplanet, a publicly listed Japanese company that adopted the MicroStrategy playbook in Bitcoin accumulation.
Since we covered a lot of ground in our conversation, this newsletter will dive into the charts and data that back up our discussion points. From current price action and ETF flows to Bitcoin’s cycle, on-chain insights, and the coming rate cut and potential recession, there’s a lot to unpack.
If you’ve already listened to the conversation (awesome! Let me know what you think in the comments), I highly recommend checking out the accompanying charts and data below. If you haven’t listened yet, here are the charts, and here’s the link to our conversation:

The Bitcoin Strategy Platform
Before we dive into the charts, here’s a quick update about improvements to the Bitcoin Strategy Platform. Right now, I’m working on adding zoom functionality, which will allow you to easily zoom into specific regions of price action and indicator values. Stay tuned!
The Bitcoin Strategy Platform offers live access to top-tier charts and indicators, all at an incredible value-for-value price. With carefully curated charts covering everything from supply dynamics to macroeconomic data, it’s the ultimate resource for tracking Bitcoin’s cycle and price action. Many exciting updates are on the way, so if you haven’t already, sign up today and get a 25% lifetime discount!
Macro & On-Chain
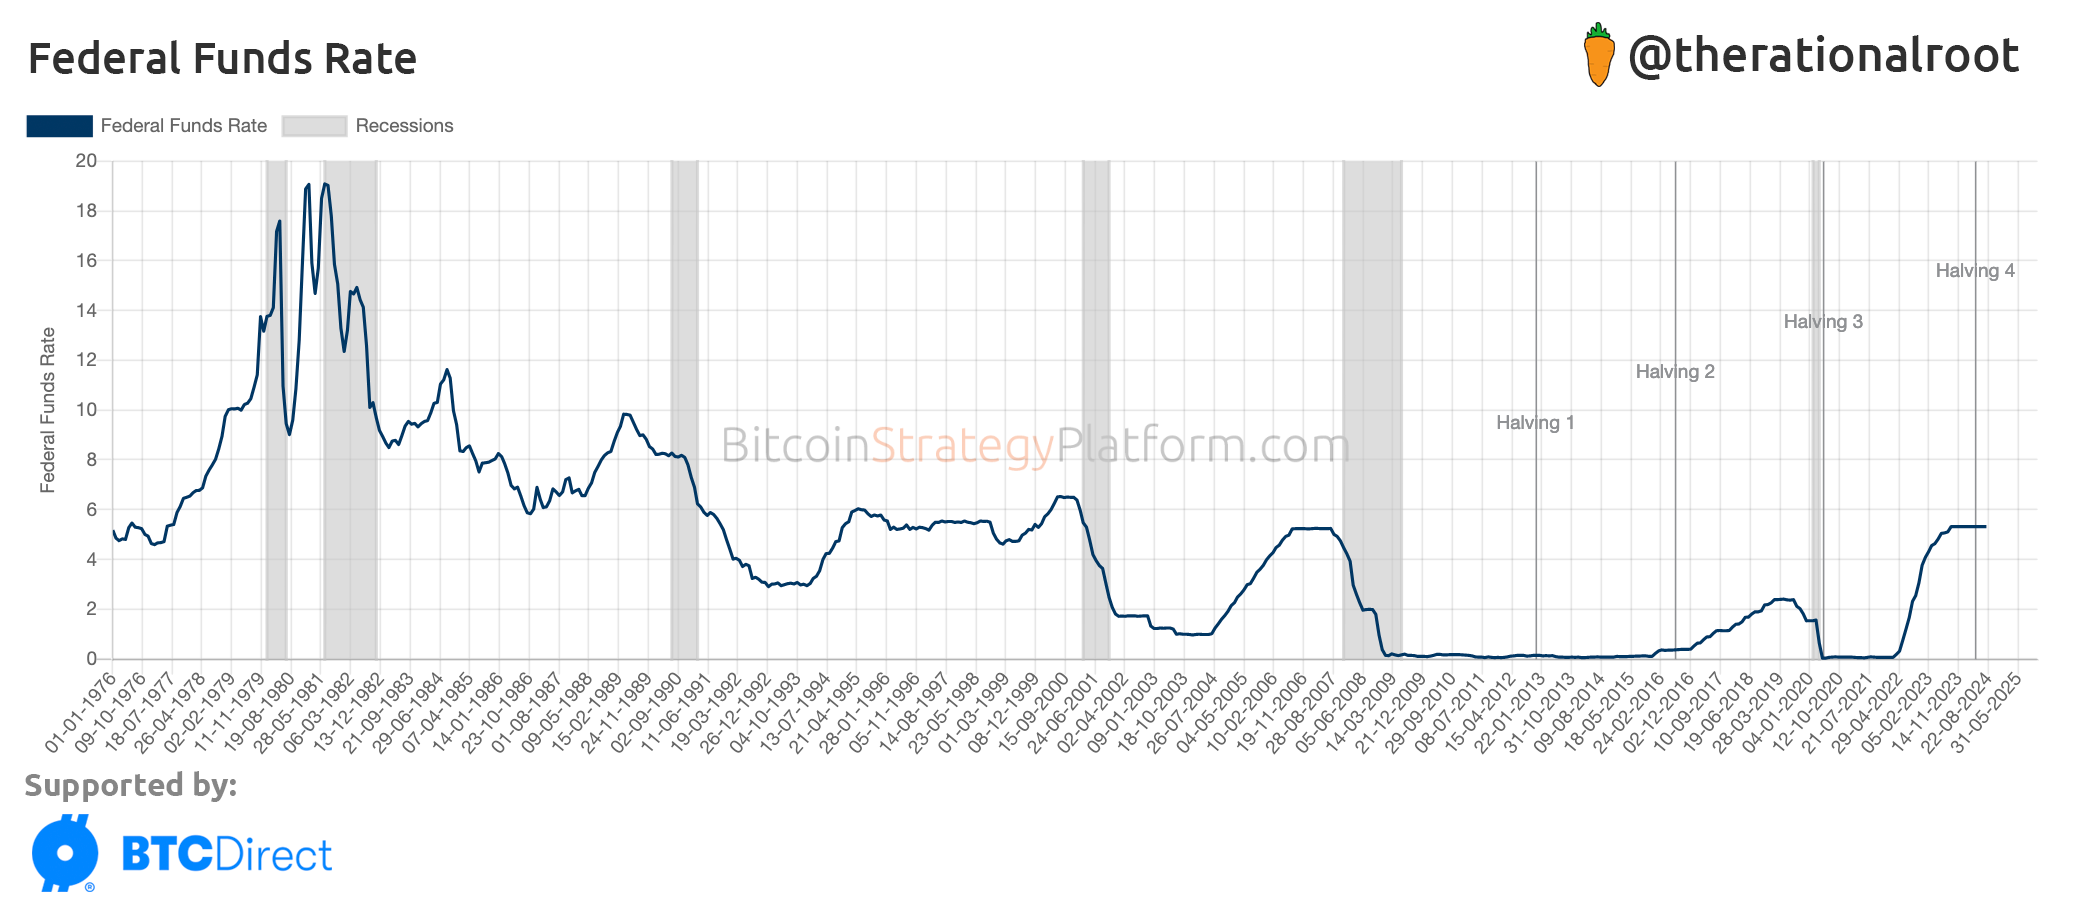
Interest Rate Cut
In the first part of our conversation, Dylan discusses the upcoming rate cut. Below is a chart showing the history of interest rate cycles by the Federal Reserve. The next rate cut is expected on September 18th, likely to be a 25 basis point (0.25%) reduction. While the Fed might consider cutting more, they are cautious about doing so, as larger cuts could signal panic over the current economic conditions.
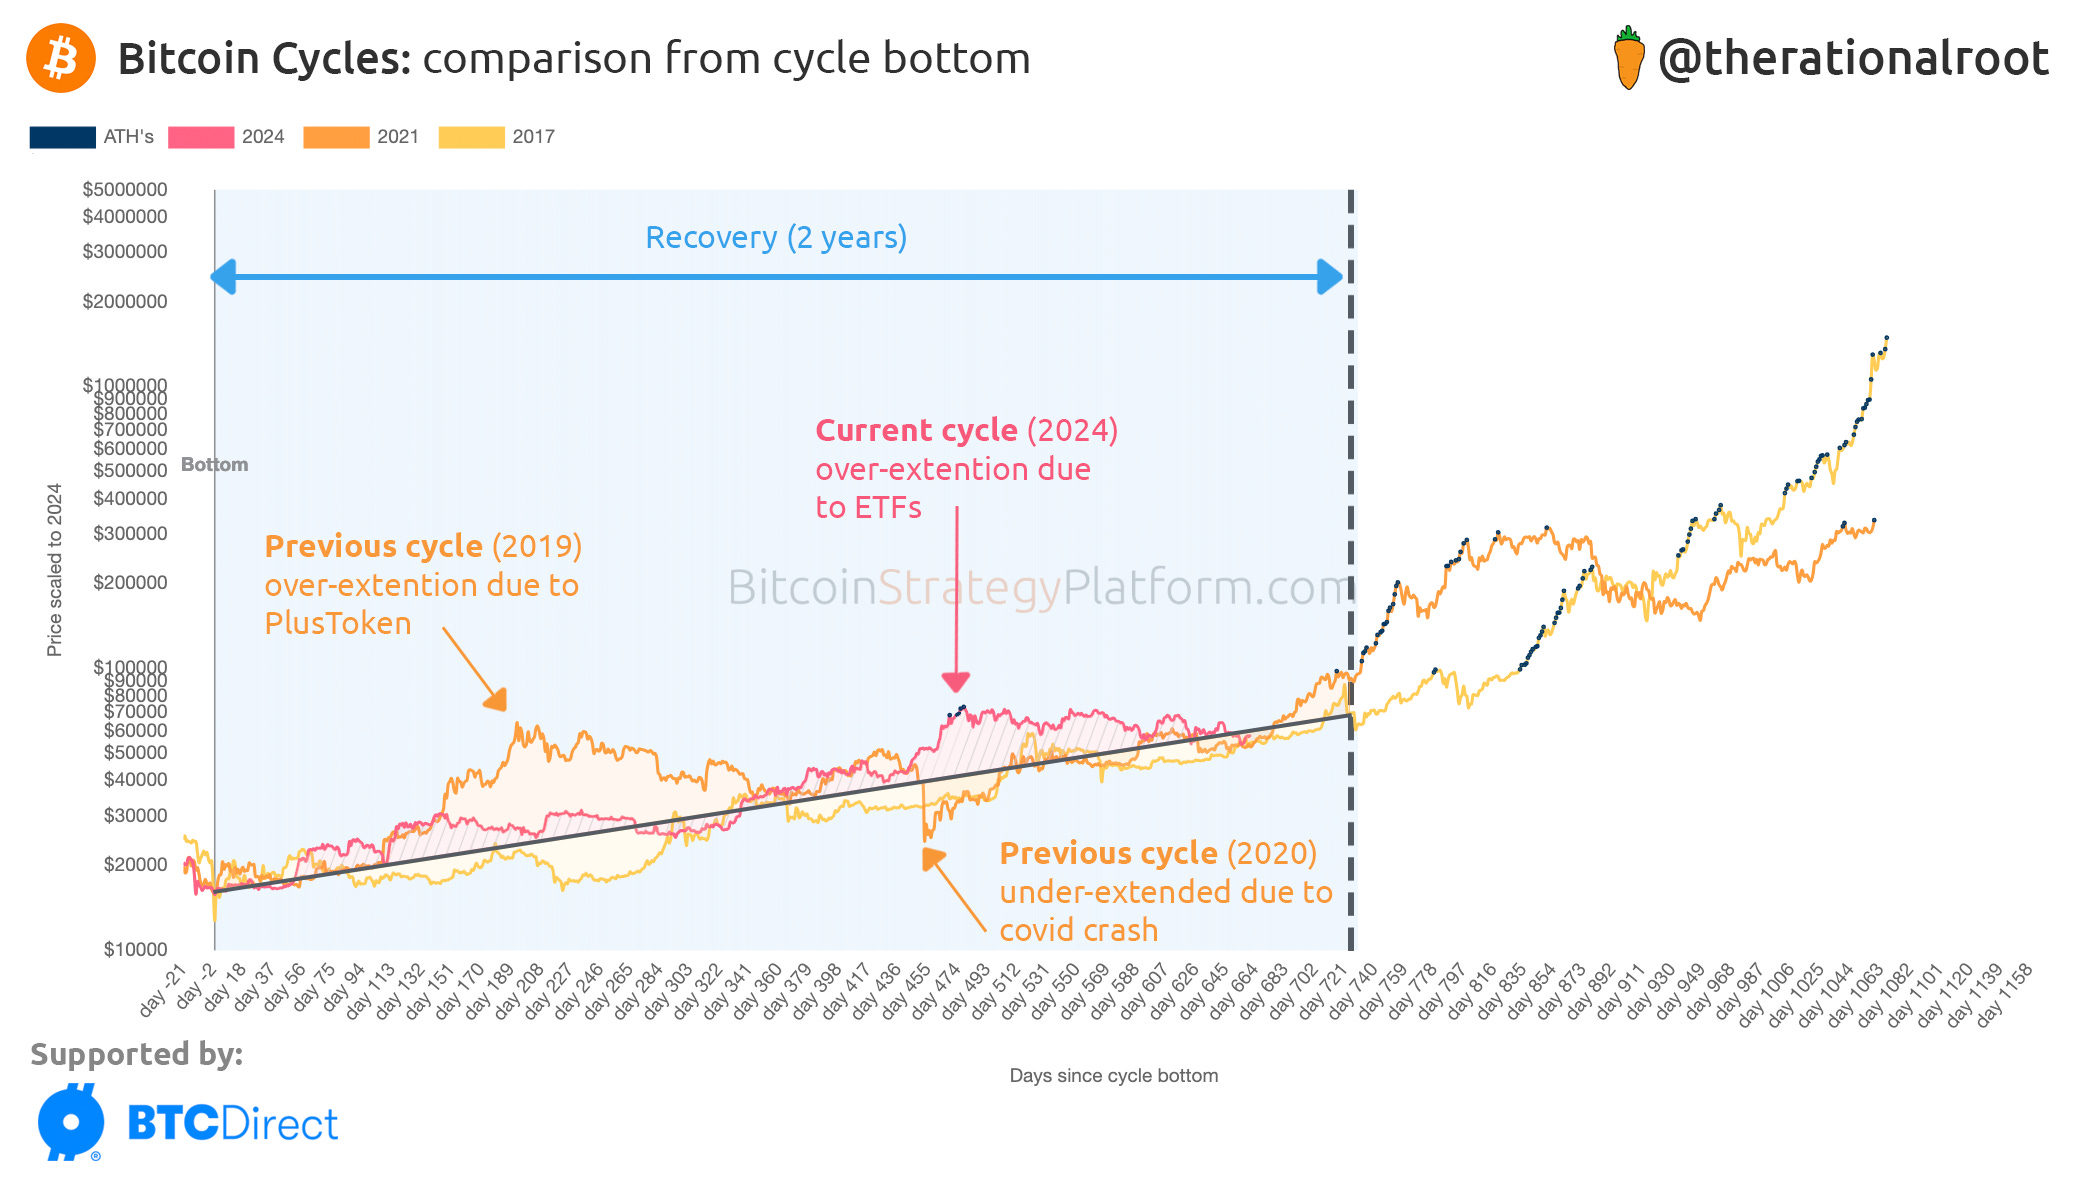
Bitcoin Cycles
The chart below shows Bitcoin’s cycles from the cycle bottom. Notice how the ETF approval caused an overextension from the mean growth rate.
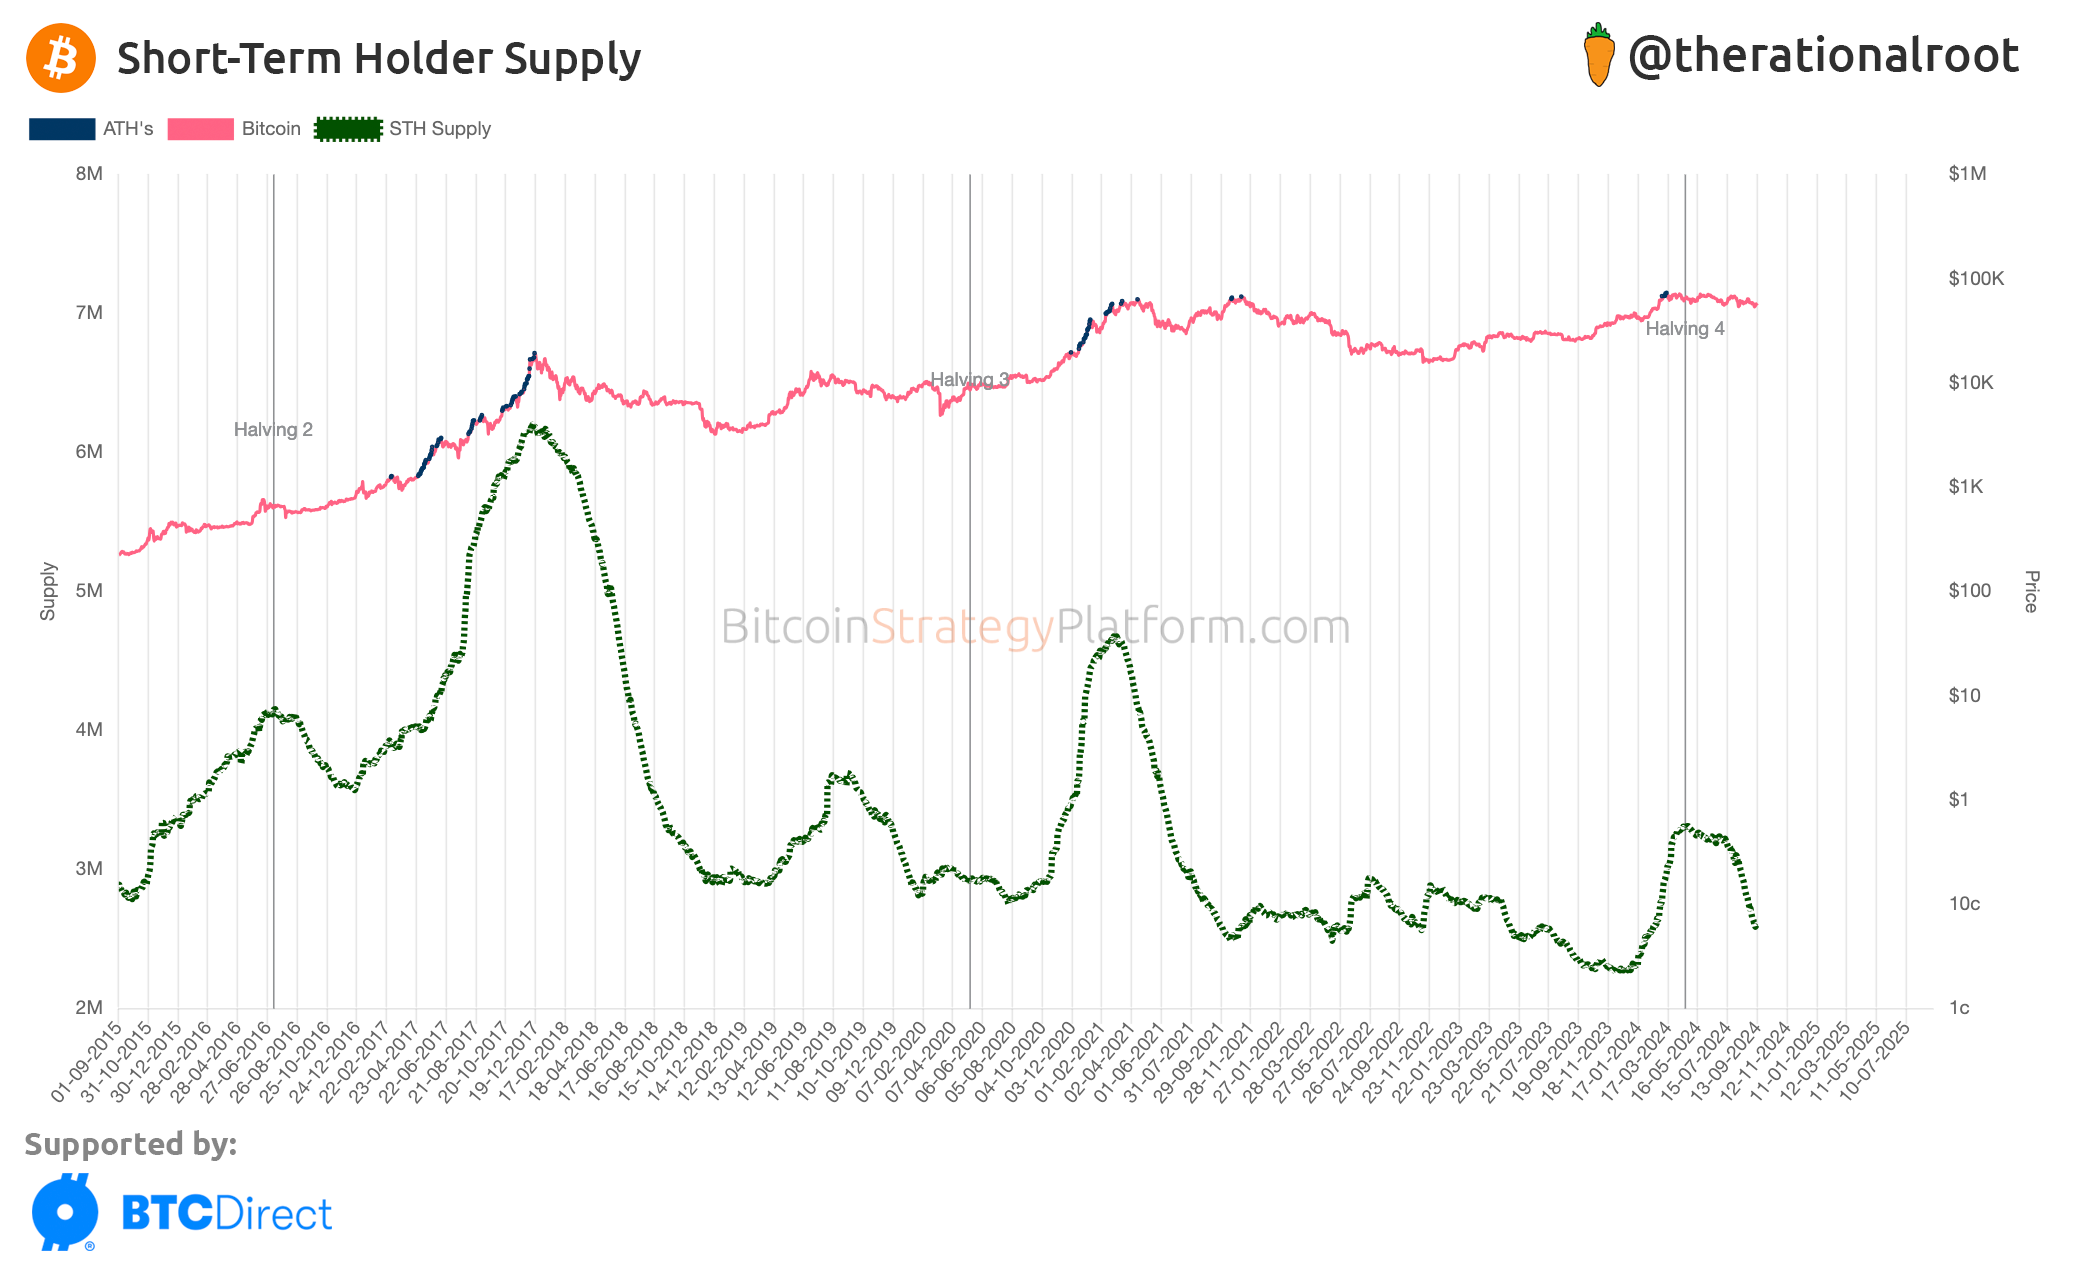
New Demand
Short-Term Holder (STH) Supply serves as a proxy for new demand. Since soon after the ETF approval, STH supply has been in decline, indicating that not many new entrants are coming into the market. A reversal of STH supply is essential for the bull market’s continuation. There’s still time, considering the 4-year cycle, but this is a key chart to keep track of!
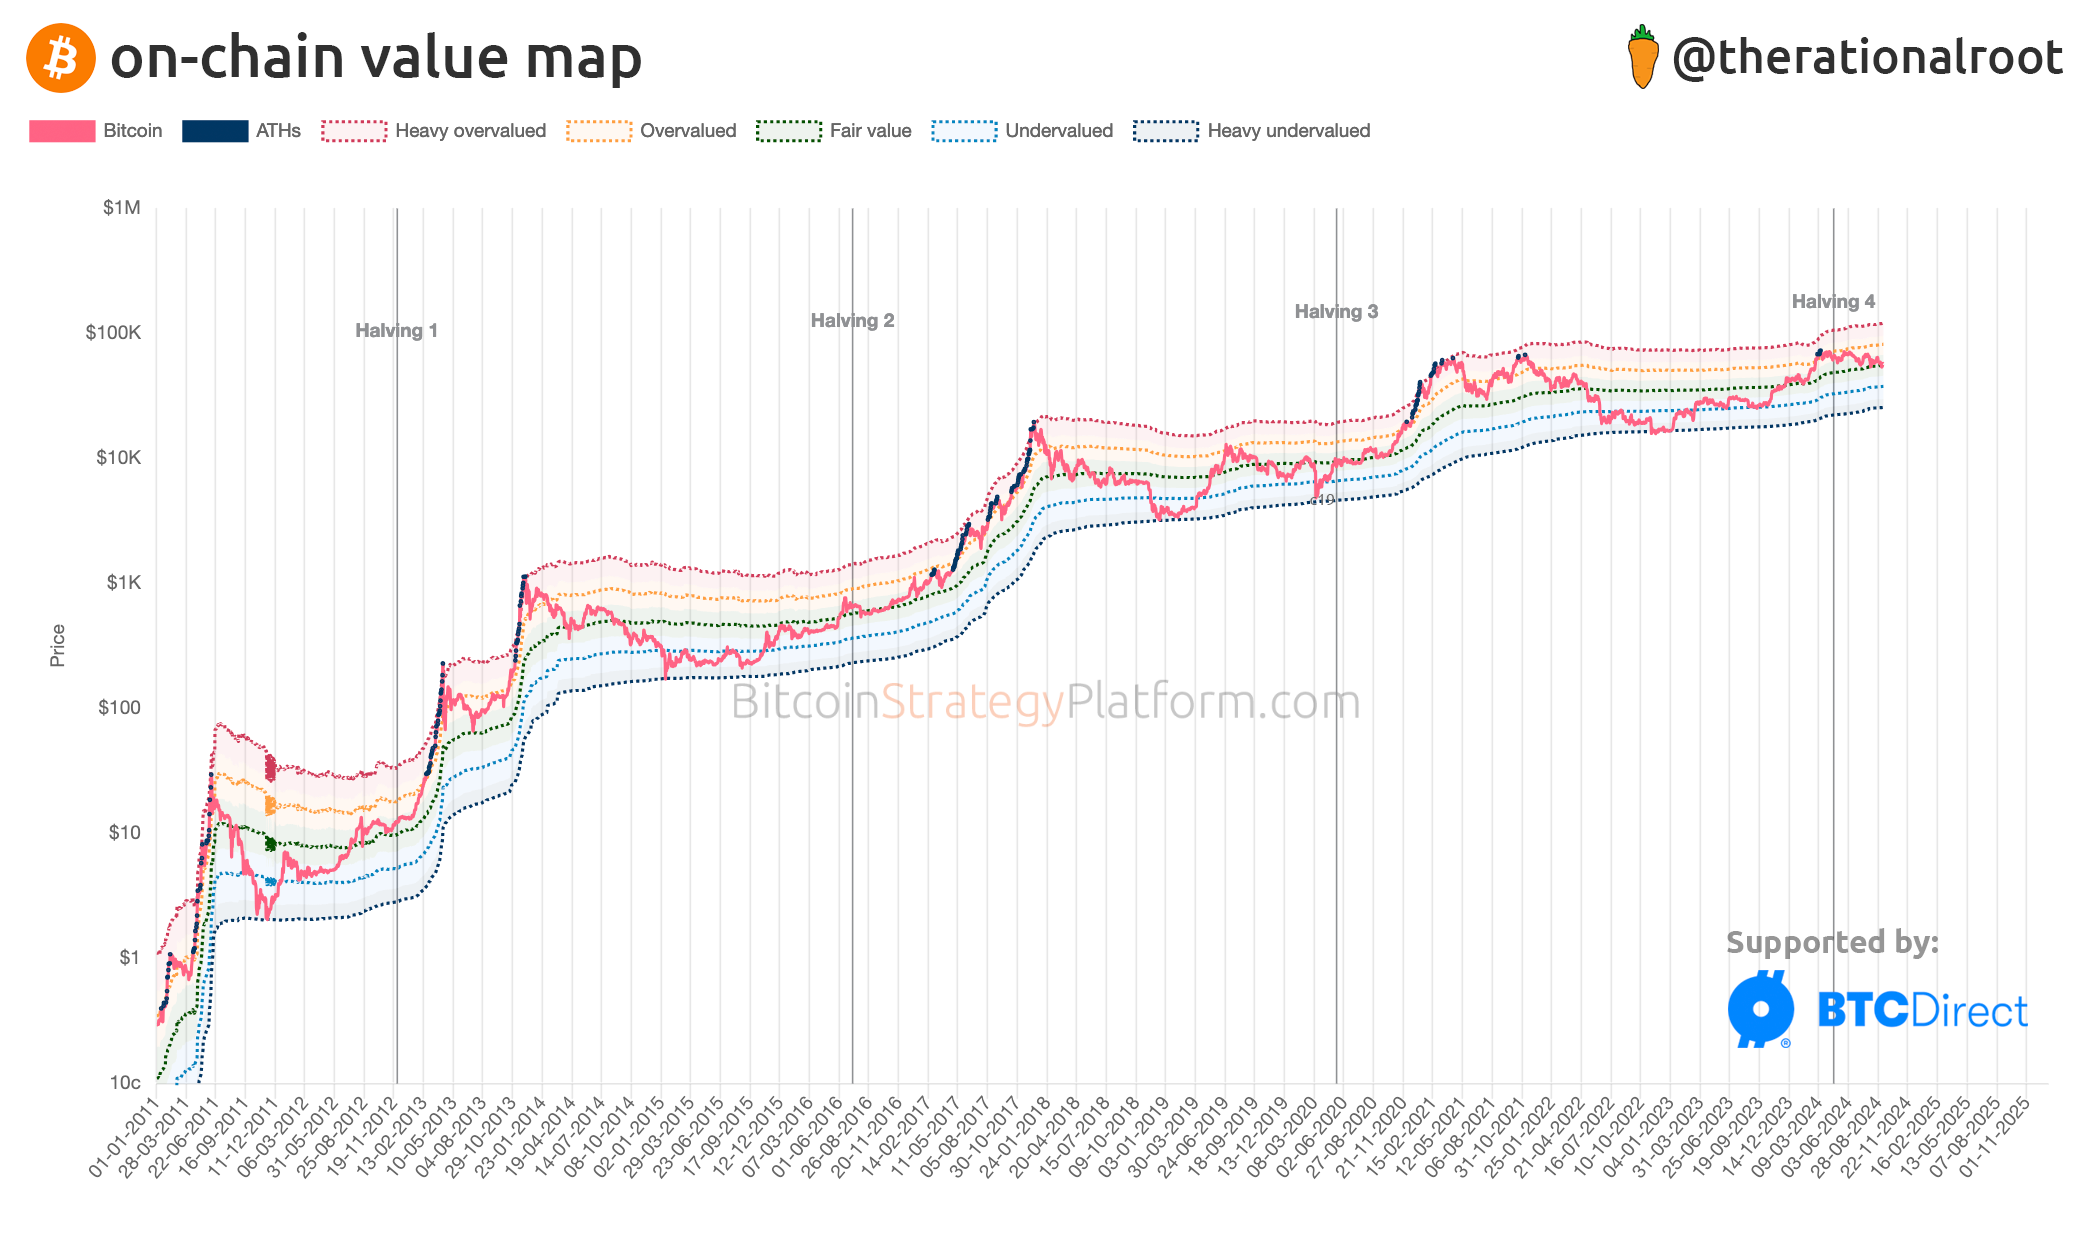
Fair Value
Aligning Bitcoin’s cycles and analyzing the average growth rate (as seen in the cycle comparison chart above) suggests that Bitcoin is experiencing a reversion to the mean. The On-Chain Value Map, based on data such as coin days destroyed, available supply, and capital flow into the market, further supports this analysis as price is currently at fair value.
Options Chain Yet to Be Approved for US ETFs
Dylan highlighted a key point: options trading for US ETFs has yet to be approved. Once institutional players can place puts and calls, they’ll be able to reduce both upside and downside risk. We’re only 9 months into the ETF approval, and many derivative products are still to come, which will likely attract even more institutional interest.
Corporate Bitcoin Adoption Report
Speaking of institutional adoption, Dylan also mentioned the newly released Corporate Bitcoin Adoption Report by River, which is a great resource for tracking corporate interest in Bitcoin.
I truly hope this conversation, along with the chart pack, brings clarity to the current situation. As always, I’d love to hear your thoughts in the comments below! 👊
Until next week! 🧡
-Root
Short term btc might be a less informative metric than it was in the past because many new entrants will be utilizing the ETFs this cycle.
Thanks for the link to the chat. Great way to start my Friday