


DCA Strategy Tool: optimal duration to spread your investment
DCA Strategy Tool: optimal duration to spread your investment
Analyzing Risks: Dollar-Cost-Average vs. Lump Sum

Hello Bitcoin Enthusiasts,
This week, we’ll reveal the ultimate DCA Strategy Tool! The tool's objective is to minimize the likelihood of experiencing negative value (in fiat currency) relative to your principal. We've all grappled with the pivotal question: "Should I buy now or wait for a drop?". If you’re aware that Dollar-Cost-Averaging (DCA) is a prudent strategy, you’re already ahead of the curve. But the million-dollar question remains: If you've opted for DCA, over what duration should you spread out your investment? If you find yourself contemplating this, then this newsletter is for you! 👊
Timing: Finding the Optimal DCA Window
What is the ultimate DCA duration? 30, 60 or 90 days? The market is a complex system and there are many variables to consider. However, one compelling and straightforward strategy is to harness our insights into Bitcoin’s 4-year cycle. A DCA strategy, which helps alleviate Bitcoin’s intra-day volatility, when paired with our cycle phase knowledge, morphs into a powerful, data-driven strategy. Through the DCA Strategy Tool, we channel this expertise into a practical investment framework.
Wonder how effective timing can be? Pause here and check my newsletter from July 2023 on the art of timing:

A big shout-out to Preston Pysh (recommended follow!) who reached out and introduced the idea of finding an optimal timeframe based on the 4-year cycle. Read our conversation here.
Introducing the DCA Strategy Tool - Now Live!
Before every future Bitcoin investment, consider a visit to www.BitcoinStrategyPlatform.com/DCA. This tool is your ally to making more informed investment decisions (not financial advice).
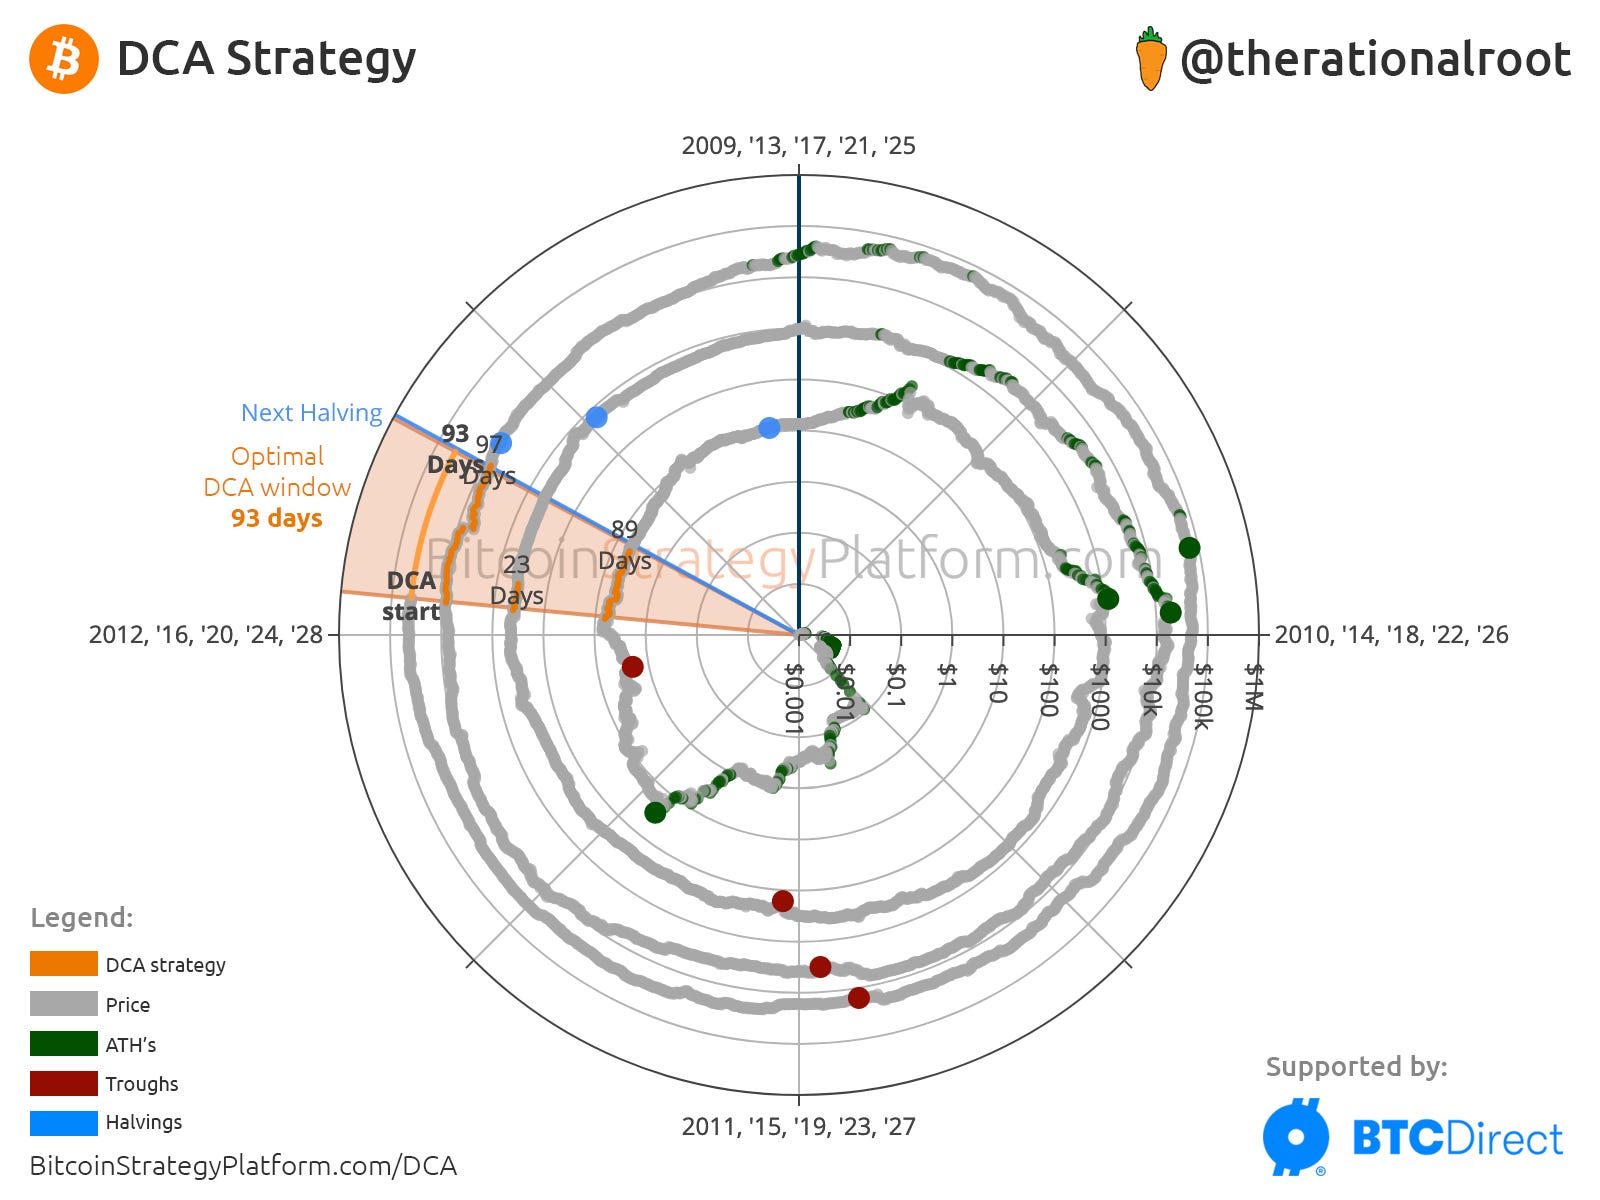
The Optimal DCA Strategy
In the chart above, we’ve calculated the optimal DCA timeframe. Here’s the breakdown:
We initiated each cycle analysis by distributing our investment from days=1 (Lump Sum) to days=4*365 (spanning a full cycle). Which interval yielded the highest BTC return?
We get the following results:
2012 cycle: 89 days
2016 cycle: 23 days
2020 cycle: 97 days
To formulate our recommended strategy, we consider the timeframe which scores best among all cycles. We select the duration that, percentage-wise, performs the closest to each individual cycle’s optimal strategy.
The Result: 93 days, Stacking until the Halving!
The current optimal timeframe across all cycles is 93 days. Coincidently, this aligns exactly with the Halving, as shown in the graph. Also, make sure check out the additional timeframe scores offered in the online tool.
A Thought Experiment & Words of Caution:
Instead of fixating on the next 93 days as the perfect entry point—acknowledging that historical data doesn't assure future outcomes—let's explore the flip side. Delaying beyond 93 days increases the likelihood of suboptimal results. Another detail worth taking into account: zooming into the past cycle, we observe that the corona crash, which is considered a black swan event, likely influenced our results towards a more extended duration. Nevertheless, a longer duration does help reduce volatility.
“Unlock the full narrative and discover advanced strategies in the exclusive section for our paid subscribers, with a 25% lifetime discount”