


60% Recovery of ATH! Spot ETF Catalyst.
Market Analysis, Downside Risk Assessment

Dear Bitcoiners,
In the past few weeks, we've been closely watching the $38,000 resistance level, and as we speak, Bitcoin is attempting to push through it. Our analysis, by observing the supply distribution, revealed the sell wall at this price, stemming from the 2021 bull run. Additionally, we noted a decent amount of unrealized profit among Short-Term Holders (STH), gauged by the price’s deviation from their average purchase price. As Bitcoin keeps marching through, there's a lot to uncover.
To dissect and gain a deeper understanding of the current setup, let's further examine a crucial price point mentioned earlier: $30,000. Its historical relevance since 2021 makes it a key level to study alongside the $38k resistance. These levels helps us better understand the setup and assess further downside risks. For a refresher on our last discussion about these levels, I refer to a previous newsletter:

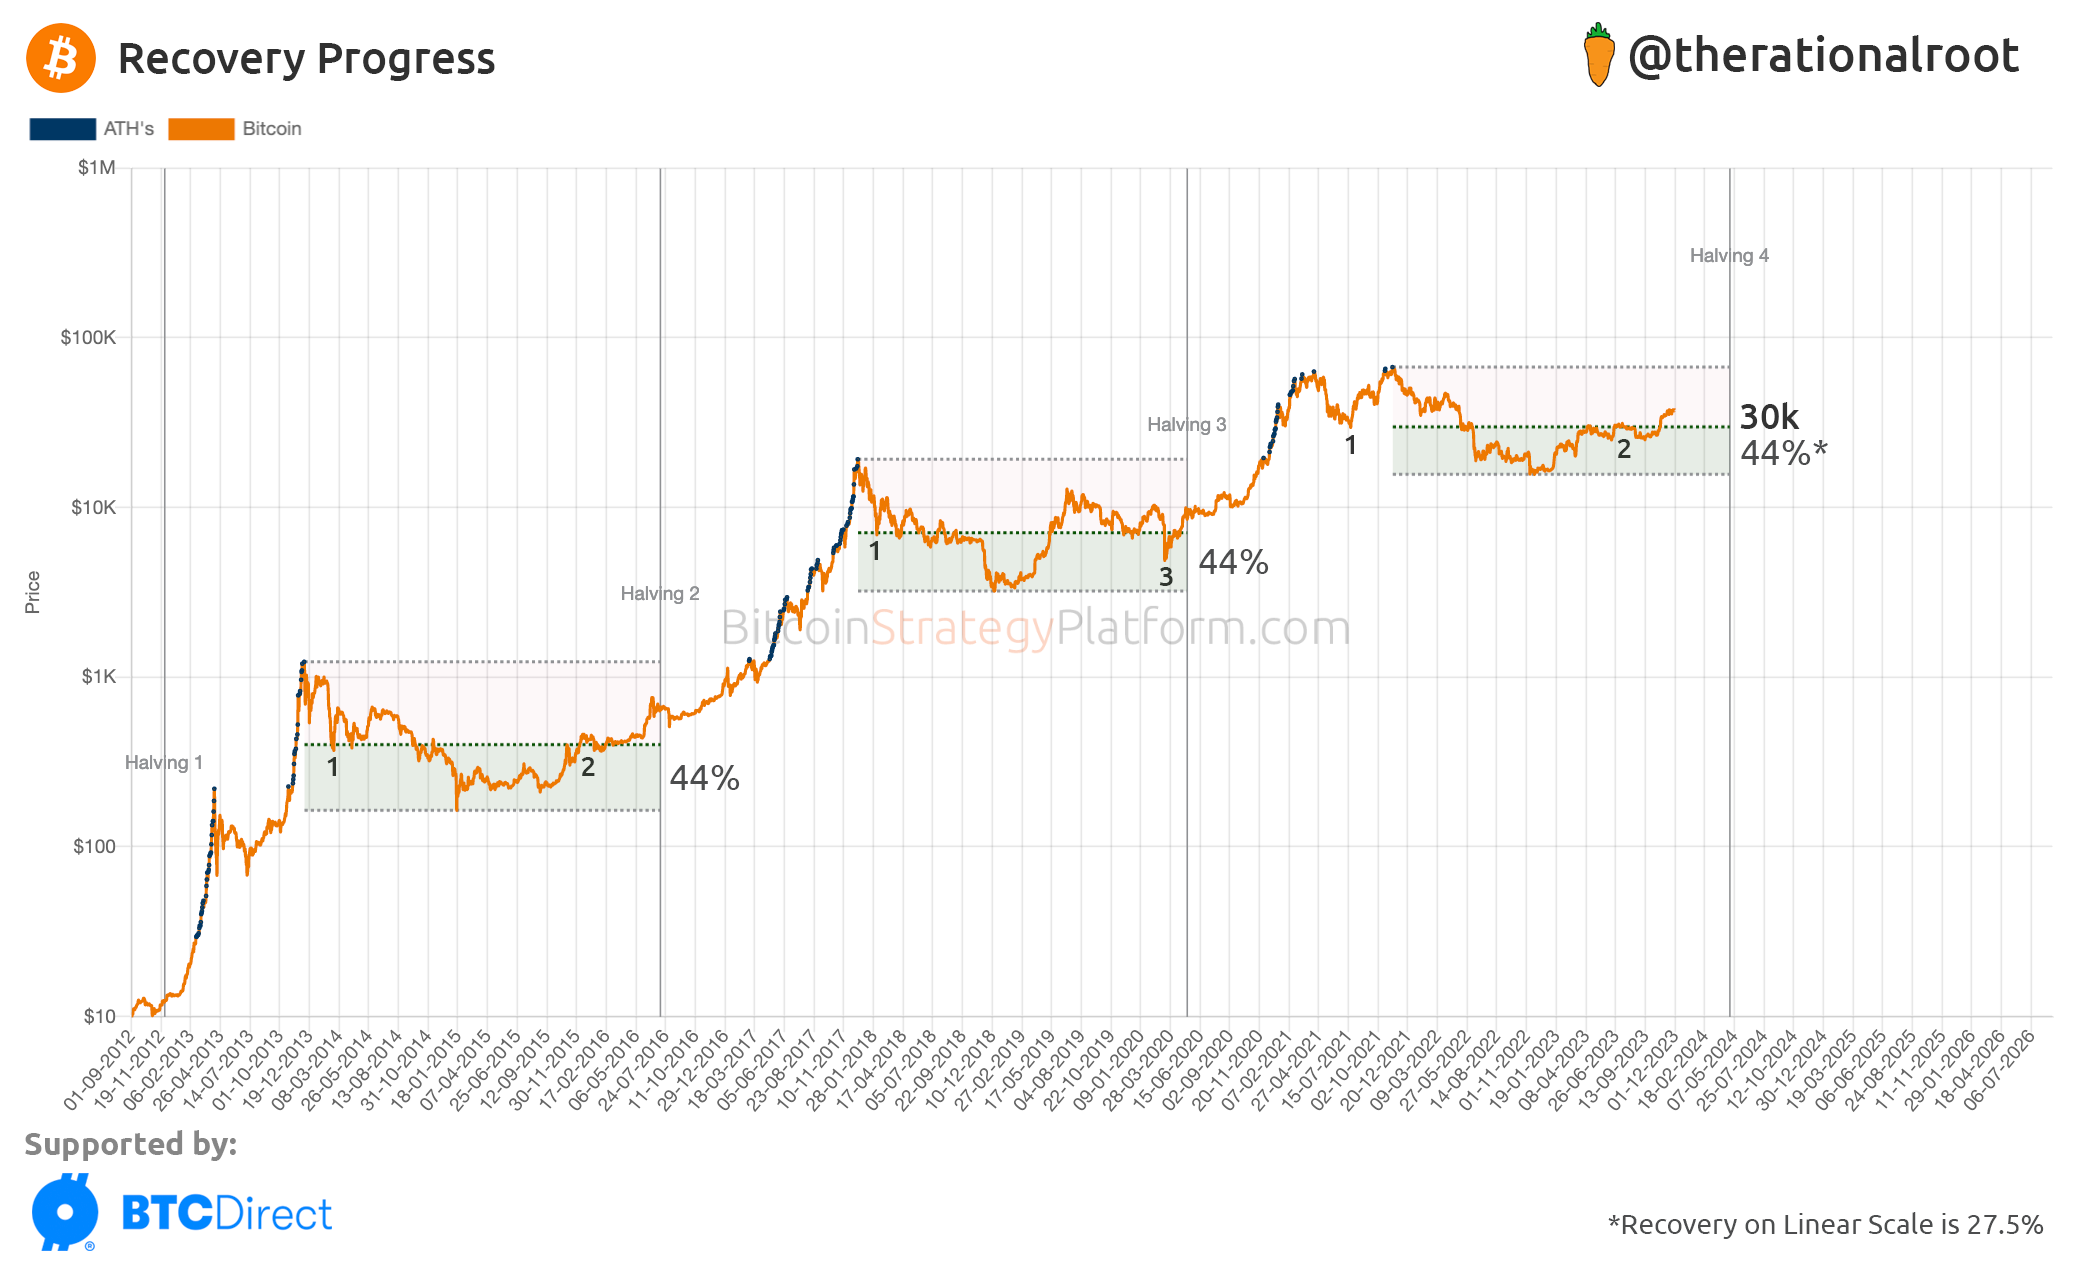
New Chart: Recovery Progress
The recovery from the trough (bottom) to the current peak is measured at 60%. Historically, prices around Halvings have tended to gravitate toward these levels in each cycle.

Note: the 60% measurement is on a logarithmic scale, which amplifies movements proportionally, showing a tenfold increase at each step. In contrast, on a linear scale, the $38,000 level only represents a 43% recovery.
Access to Full Newsletter Content and the Bitcoin Strategy Platform with LIVE indicators and charts .
Grab the 30% discount before Christmas.
Cycle Comparison
With Bitcoin breaking through the $38,000 level and with a 60% recovery already in play, a figure typically seen near Halving events, one might question if we’re currently overvalued. To address this, let’s discuss the downside risks. For this we compare the $30,000 level to prior cycles, aligning the recovery (green areas) to 44% - resulting precisely in the current cycle’s $30,000 mark.
Key Insights
Cycles tend to retreat to this level after initial peaks.
It acted as resistance in 2015 and now.
Rarely has it dipped below (Covid being an anomaly close to Halving 3).
We’ll now further enhance the above chart by incorporating the Short-term Holder cost basis and another potential driver for this rally, the Spot ETF deadline!