


100k before the Halving?
100k before the Halving?
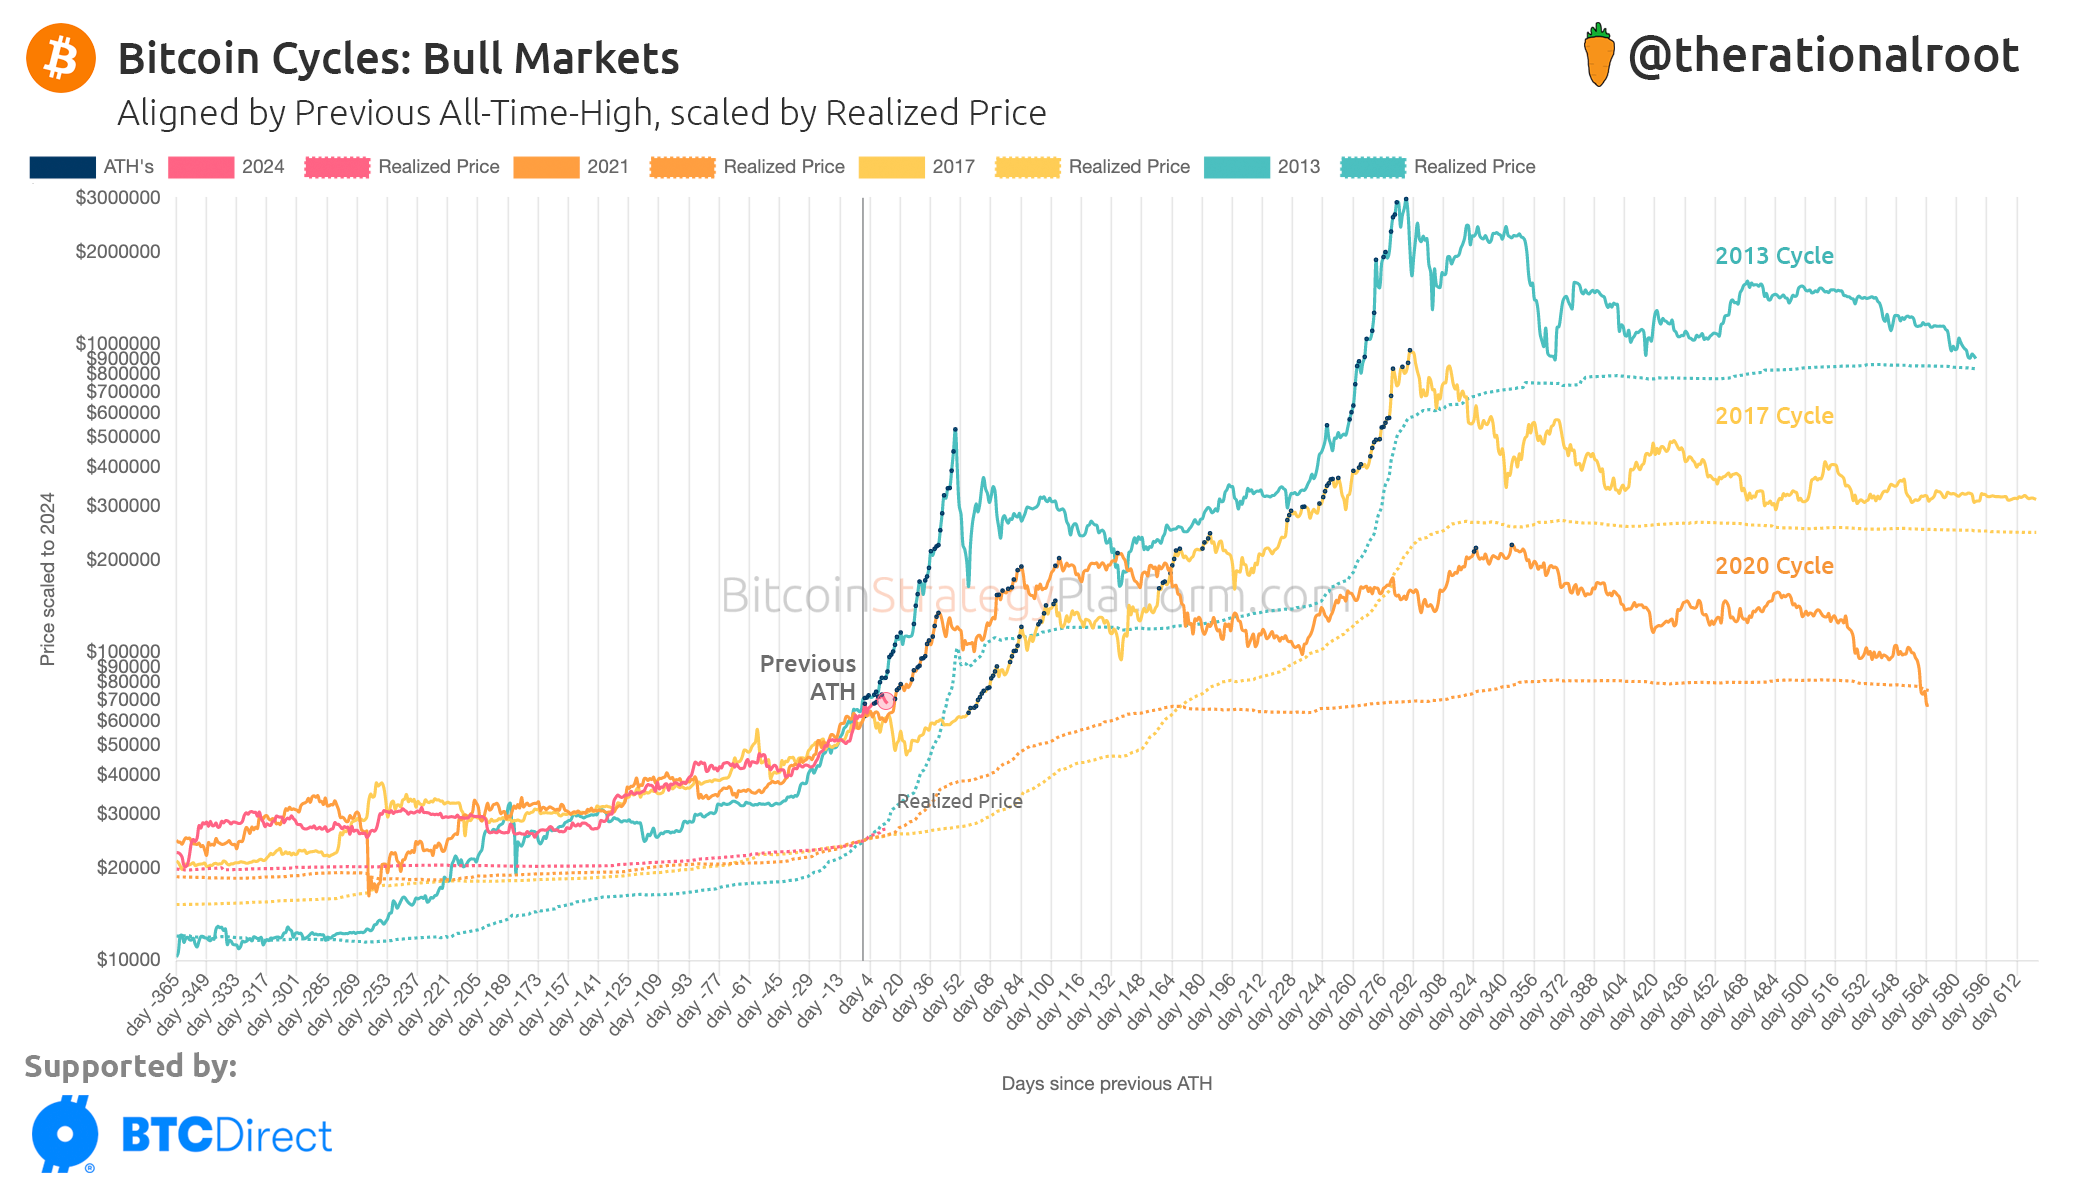
NEW CHART: Bitcoin Bull Market Comparison

Dear Bitcoiners,
With provable ETF demand, which I have extensively discussed in my latest appearance on What Bitcoin Did, and with reaching new ATHs, we’ve undeniably been in a bull market. I am excited to share the latest chart added to the platform: Bitcoin Bull Market Comparison.
Bitcoin Strategy is a reader-supported publication. To receive new posts and support my work, consider becoming a free or paid subscriber.
100k before the Halving?
The above alignment makes a 100K target seem reasonable in the months ahead.
The historical data suggests the most significant price increases happen in the months ahead and that this is not the best time to be sidelined.
Realized Price, the average purchase price of all Bitcoin indicated by the dotted lines, is gaining momentum, suggesting a more rapid increase than in the previous two cycles.
When Bitcoin reached new All-Time Highs in 2020 and 2017, we saw a correction that lasted over two weeks and nearly two months, respectively. It is absolutely normal for the market to consolidate and take some time to regain strength after jumping from 40k to 70k in a month.
Disclaimer: The information provided in this newsletter should not be treated as financial advice.
⚠️ PSA: Please beware of impersonators!
Recently, some people have lost a lot of money to impersonator accounts; a real tragedy!
I am only active on X and Nostr and go by the handle “@therationalroot”. The only other mediums I use are:
My Newsletter: bitcoinstrategy.substack.com
My Platform: BitcoinStrategyPlatform.com
I am NOT on Instagram, Telegram, or any other social media platform. I don’t do any solicitation. If someone reaches out to you using credentials similar to mine, they are scammers, so please beware.
Key Insights
Now, let’s look at an enhanced version of the above chart and discuss additional key insights.