Dear Bitcoiners,
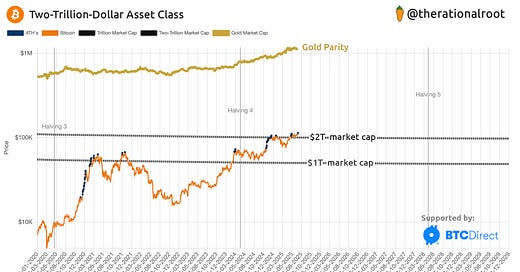
Bitcoin just hit a new All-Time High, lifting off from the 2-trillion-dollar market cap!
Over the past few weeks, we’ve talked about how Risk-On Momentum Was Building and how Bitcoin was On the Brink of a New ATH. Everything we’ve covered lined up perfectly with what we’re seeing now!
A $100K Bitcoin and $2-trillion market cap is establishing itself as the new baseline.
In this newsletter, I’ll explain why a $100K Bitcoin and $2-trillion market cap is establishing itself as a baseline, based on new on-chain insights. Plus, I’ve got a new chart for you with valuable insights on this bull market.
But before we jump in, here are links to key charts from recent newsletters that remain relevant:
Key Charts Worth Tracking
Risk-on momentum: Performance of Bitcoin vs the S&P 500 and Nasdaq 100.
Temporary FREE access to this chart 👇 for all subscribers!
STH Cost Basis: Bullish divergence in terms of standard deviations
STH Supply: Bottom formation progress
Unlock full access to the Bitcoin Strategy Platform. Sign up today and claim a 25% LIFETIME discount!
Let’s now dive into the fundamental developments unfolding on-chain. These provide strong insights into the continuation of this bull market.
We already had a way to determine local tops with our STH Momentum Indicator, this NEW chart will help us better identify local bottoms. It’s a must-have in your on-chain toolkit.


