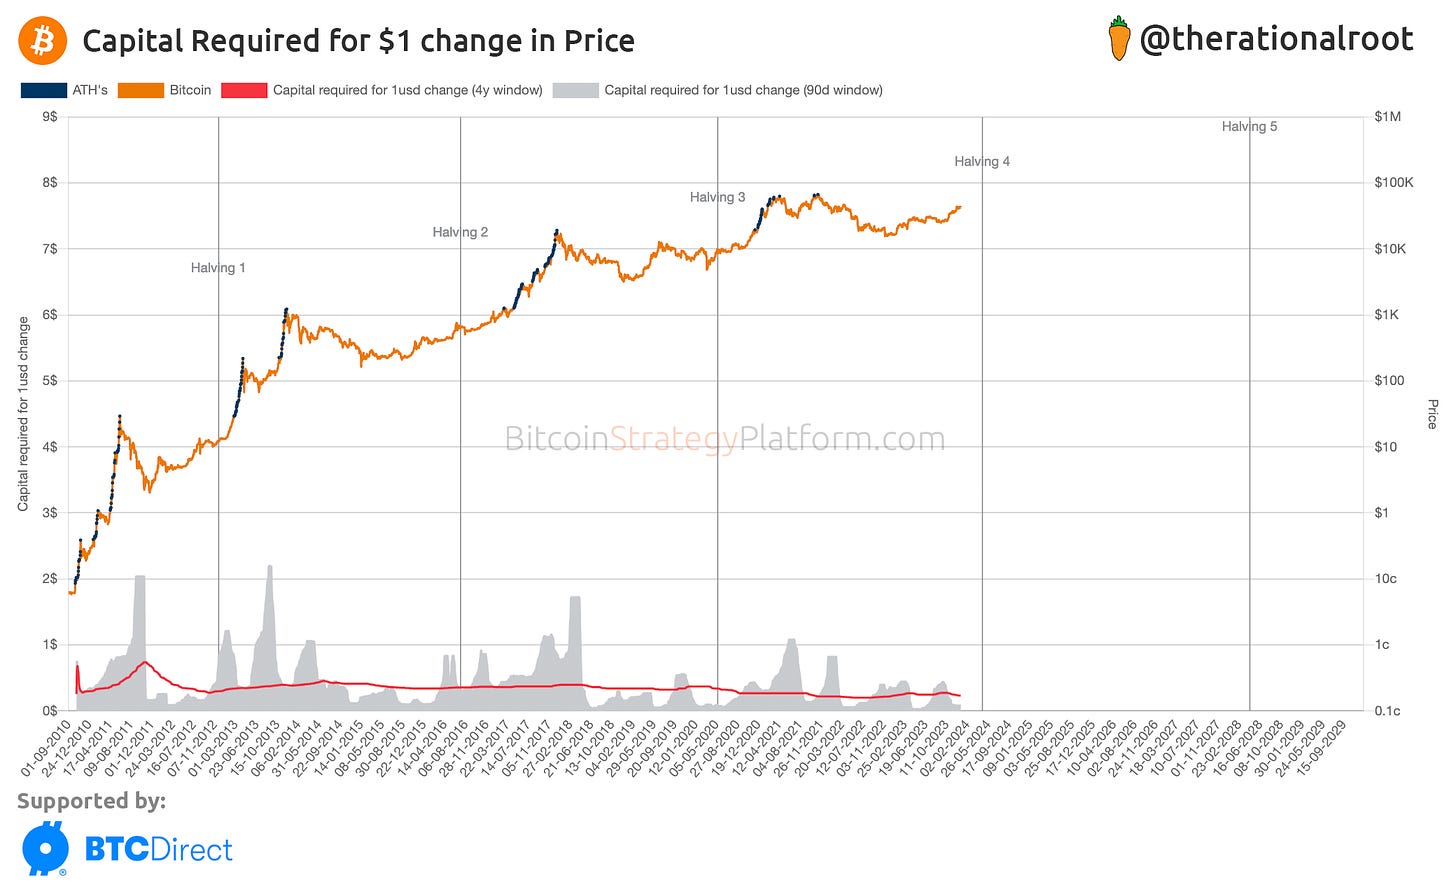
Capital Flows, Year-End Special!
Price prediction!
Hello, Bitcoiners!
I truly hope you had a lovely Christmas and are ready for our year-end special! In this year’s last edition, we’ll talk about capital flows into Bitcoin and price predictions! To be more specific, we’ll look at how much capital is needed to move the Bitcoin price. The on-chain toolbox provides amazing techniques to observe these patterns, which we’ll soon explore.
2024 will be a fascinating year with likely ETFs, the Halving, and a US Election! It’s going to be quite the ride, and I am here to assist you with the best indicators and data 💪. Bitcoin Strategy now has over 6,000 subscribers in just these past few months. I’m proud and truly grateful for your support!
Capital flows
There is quite some controversy around how much capital is needed to move the Bitcoin price. There was a report from Bank of America from March 2021 that reported a 118x multiplier, meaning for each dollar invested the Bitcoin market cap would go up 118 dollars. Supposedly, they calculated this by measuring the causality of the futures ETF market on the Bitcoin spot price. With derivatives only being a limited part of the broader market, other questionable data in the report, and the on-chain observations we’ll discuss below, I doubt the reliability of this number. So, let’s dive deeper into this topic!
Why do we care about the multiplier?
The answer is simple: the higher the multiplier and considering general inflows into Bitcoin, the higher Bitcoin’s price can go. Spoiler: We’ll look at some actual predictions using this method.
Realized Cap
One of the most fundamental on-chain indicators is the Realized Cap. Unlike the market cap, which is simply all of Bitcoin’s supply times the current price, the Realized cap measures the actual capital flows into Bitcoin by looking at the price paid on a per-transaction basis. It’s a proxy for the capital invested in Bitcoin. The realized cap divided by the supply gives us the Realized Price (also known as the average purchase price of all Bitcoin), an indicator you’re most likely more familiar with.
Observing the Market Cap & Realized Cap gives us a similar perspective as looking at the Bitcoin price and the Realized Price. Essentially, these are the same, except in the latter case, we divide both by the circulating supply.
How can we use the Realized Cap?
Since the Realized Cap tells us how much money is invested into Bitcoin, the change in the Realized Cap tells us whether money is flowing in or out. An increasing Realized Cap means more money is entering Bitcoin, and a decreasing one means the opposite.
By looking at the change in the Realized Cap vs the change in the Market Cap we can measure how much capital is needed to move the bitcoin price.
Disclaimer: While arguably, on-chain data doesn’t encapsulate the entire market, the actual BTC moving on-chain represents a large part of the market portion. Thus, it can reliably be used as a proxy. Furthermore, on-chain trends are likely to continue due to Bitcoin’s growing network effect and cycle.
How much capital is required to move the Bitcoin price?
Measuring the change in the Realized Cap vs the change in the Market Cap, a solution proposed by Glassnode, we get a multiplier of ~4x, and depending on the rolling window used, could move between 1 and 32x. This is a lot lower than the previously reported 118x. While at certain times the multiplier might actually be as high as 118x, it constantly fluctuates with Bitcoin's complex market dynamics of available supply and demand that define Bitcoin’s price. However, taking the median (to reduce outliers) over a long enough timeframe gives us a multiplier of around 4x. Note that this multiplier is likely on the conservative side as not every transaction is actual capital flowing into Bitcoin.
With a ~4x multiplier, ~25 cents are needed to move the Bitcoin market cap by a dollar.
Get a 30% lifetime discount with access to the Bitcoin Strategy Platform (including live charts & indicators) and full analysis!
Offer available until the year's close.
The next part will be fun, let’s apply these metrics to get some actual predictions! You probably noticed the $300B, $800B and $1.7T inflows to the Realized Cap (first chart).
They are an estimate of possible capital inflows using a conservative, pragmatic, and optimistic approach taking into account the total Assets Under Management (AUM) of the Spot ETFs to highly liquid capital in the world. Let’s examine these scenarios more closely:
Scenario 1: $300 Billion inflow
Based on a 1% allocation of the 30 Trillion ETFs Assets-Under-Management combined. I call this the conservative scenario. Money can flow into Bitcoin from many sources, not just ETFs. Additionally, based on historical behavior, the Realized Cap curve for this prediction looks fairly flat,making this a feasible target if the network effect continues.
Scenario 2: $800 Billion inflow
This scenario is based on an inflow equal in size to the current Market Cap and, more importantly, takes into account the diminishing effect of the Realized Cap.
Scenario 3: $1.7 Trillion inflow
This scenario is based on a 1% allocation of the ~170 Trillion of highly liquid capital that exists in the world. I call this optimistic because it would need an equal inflow (on log scale) to the previous bull market (as seen by the equally sized red-dashed-outline box).


